![]()
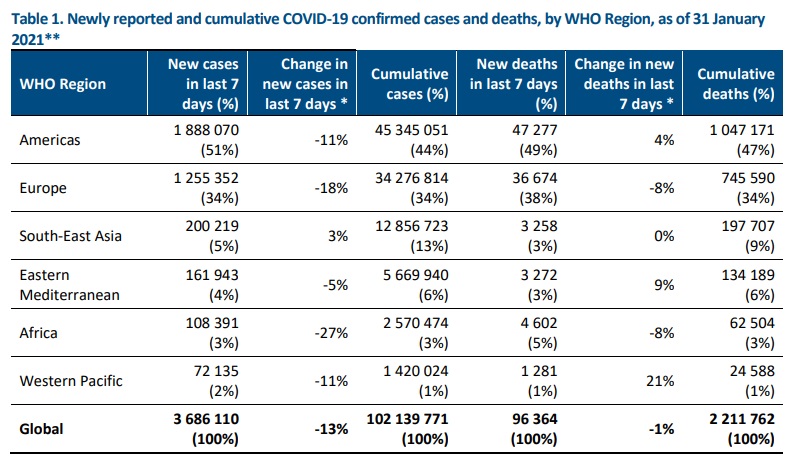
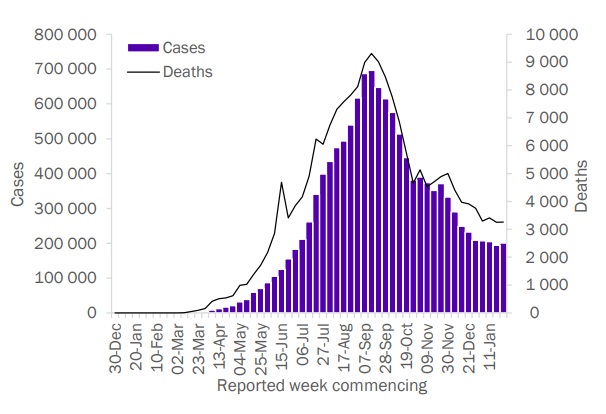
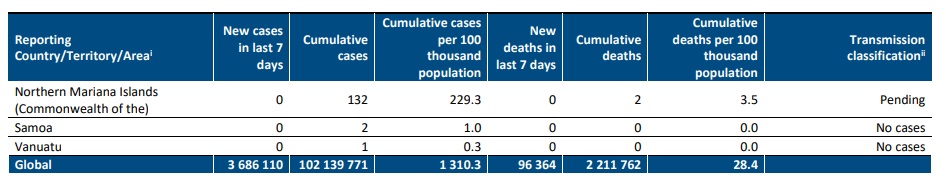
Globally, 3.7 million new cases were reported last week, a 13% decline as compared to the previous week, and the third consecutive week showing a decline in cases. There were 96 000 new deaths, and a 1% decline as compared to the previous week, (Figure 1). This brings the total number of cases to over 102 million and the total number of deaths to 2.2 million from 222 countries and territories. Last week, all WHO regions, except South-East Asia reported a decline in new cases (Table 1). Although new deaths declined globally by 1%, they rose in the Western Pacific (21%), Eastern Mediterranean (9%), and the Americas (4%).
Saturday 30 January 2021 marked one year since WHO declared COVID-19 a Public Health Emergency of
International Concern. At that time, there were 9826 cases in 20 countries, and 213 deaths in one country (all
of which were in China).
In the past week, the five countries reporting the highest number of new cases continue to be the United
States of America (1 072 287 cases, a 15% decrease), Brazil (364 593 cases, a 1% increase), the United Kingdom
of Great Britain and Northern Ireland (178 629 cases, a 31% decrease), France (141 092 cases, a 2% increase)
and the Russian Federation (131 039 cases, a 13% decrease).


Special Focus: COVID-19 and Health Workers
In his press briefing of 29 January 2021, WHO Director-General Dr Tedros again emphasized that healthcare workers have been at the forefront of the response to the pandemic but are often under-protected and overexposed. He reiterated his 18 January 2021 call to action: for governments and industry leaders to work together to ensure that in the first 100 days of 2021, vaccination of health workers and older people is underway in all countries.
In this Special Focus – recognizing that 2021 has been designated as the International Year of Health and Care
Workers – we present an overview of health worker SARS-CoV-2 infections using data collected via the WHO
Global Surveillance systems, and analyse risk factors from available scientific literature.
To date, a total of 183 countries have reported data via WHO Case Report Forms (CRFs) to date, covering 37
million cases (36% of current global COVID-19 cases). The CRFs were mainly received from Member States in the
Region of the Americas and European Region. Over 16 million CRFs (43% of CRFs received, representing 16% of
global COVID-19 cases) included information on occupation status, including health workers
. Within this subset, health workers accounted for close to 1.29 million COVID-19 cases, or 8% of cases. The median age of health worker cases was 42 years (interquartile range 27 to 60 years), and 68% were women. This is in line with the proportion of women working in the health and social sectors globally.
At the outset, it is important to mention that the analyses based on CRF data provided to WHO has limitations,
mainly due to variations in reporting coverage and completeness, reporting methods, some irregularity of
weekly reports, health worker definitions, and lack of information about the setting of exposure. WHO advises
Member States to use the definition of health workers as stated in the Surveillance Protocol for SARS-CoV-2
infection.
Percentage of health worker infections and relative risk over time
It is important to acknowledge that country-specific trends remain highly variable, and the data are based on
reported cases (those testing positive for SARS-CoV-2) often without providing information on the overall
number tested. Therefore, it is difficult to reliably compare incidence of health worker infections over time and
trends should be interpreted with caution due to variations in reporting coverage and completeness,
adaptations to testing strategies, differences in the implementation of public health measures and
interventions, as well as differences in the circulation of SARS-CoV-2 in the community over time. Additionally,
it is not possible to determine the place of exposure (e.g., health care facility or community) among health
workers from WHO CFR data.
Based on WHO CRF data, in the first three months of the pandemic, health worker infections slightly exceeded
10% of reported cases (Figure 3), declining to less than 5% by early-June 2020 (Epi week 2) and to approximately
2.5% by September 2020
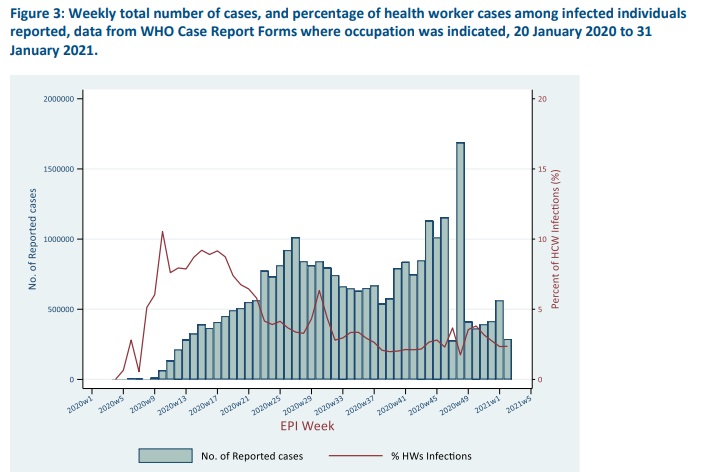
A relative risk measure (dividing the rate of health worker infections by that of the non-health workers) was calculated for each week by estimating the total number of health workers and non-health workers. The rate of health worker infections was calculated by dividing their number by all workers employed in the health and social sector. A similar rate of infection was calculated for non-health workers relative to the general population size. It must be noted that there has likely been surveillance bias and differences in testing of health workers compared to general population, particularly early on. Based on the data we have available, it is observed that health workers experienced more than triple the risk of infection as that of the general population in the period between mid-March to mid-May 2020. A similar level of relative risk3 was also reported by an observational cohort study of about 2 million community individuals and 100 000 front-line health-care workers in the United
Kingdom of Great Britain and Northern Ireland, and the United States of America. Our data suggests this period
of elevated risk was followed by a steep decline to that found in the general population by end of May 2020.
Analysis of health worker risk factors
WHO first commissioned a rapid systematic review of published literature on the risk factors in health workers
for SARS-CoV-2 infections in April 2020 and this has been updated regularly since. The latest update on 24
December 2020 identified a total of 37 studies evaluating risk factors associated with SARS-CoV-2 infection in
health workers. Highlights include:
• SARS-CoV-2 infections occurred among health workers in various roles (clinical or non-clinical) and
departments/settings (including outpatient and non-COVID-19 care settings).
• There was no consistent difference in risk of infection between job titles, including between nurses
compared with physicians, which represented the most commonly reported health worker roles.
3 Adjusted HR 3·40, 95% CI 3·37–3·43
• There was no association found between sex or age and risk of SARS-CoV-2 infection or seropositivity in
health workers.
• African-Americans and Hispanic health workers had an increased risk of SARS CoV-2 infection.
• Education and training in infection prevention and control were associated with decreased risk of SARSCoV-2 infection in health workers.
• Certain exposures such as those involving intubations, other aerosol-generating procedures, direct
patient contact, or contact with bodily secretions were found to be associated with increased infection
risk compared with less intensive or direct exposure; though evidence was inconsistent, likely related to
confounding factors such as those related to the availability, distribution, and use of PPE.
• Evidence on the association between health worker infection and use of individual PPE measures (masks,
gloves, gown, eye protection) and hand hygiene was limited. However, most studies found that
availability and appropriate use of PPE as recommended by local authorities was associated with
decreased risk of SARS-CoV-2 infection. Evidence on the use of N95 or FFP2 respirators versus
medical/surgical masks was inconclusive and limited to two inconsistent observational studies. Further
information on the use of masks in health facilities can be found in the interim guidance on mask use in the
context ofCOVID-19.
• Three studies found that universal masking in health facilities was associated with decreased risk of
SARS-CoV-2 infection in health workers.
A number of possible hypotheses may help to explain the observed trends in health worker infections. The
higher proportion of health worker infections at the beginning of the pandemic in some countries may be due
to the lack of preparedness to infectious disease outbreaks, of standard IPC precautions during care delivery,
and reduced access to PPE, and overburdened health systems due to increased hospitalizations and limited
health care capacities. Trends could also reflect different testing strategies prioritizing health workers over the general public. The subsequent decline in health worker infections could be a result of multiple interventions, including: i) training of health workers on IPC measures; ii) increased availability and appropriate use of personal protective equipment (PPE); iii) monitoring of IPC practices by occupational health and safety personnel; iv) improved clinical management based on improved knowledge about COVID-19, v) reduced bed capacity of COVID-19 patients in hospitals; vi) general reduction in community transmission with implementation of public
health and social measures resulting in less pressure on hospital systems and hospitalizations; vi) increased
SARS-CoV-2 testing capabilities; and, vii) increased knowledge of methods of transmission. Hence, it is
impossible to determine from the available data how these interventions (individually or as a mix) contributed
to the observed trends.
The WHO review of available studies found that observational studies provided important insights but had some
methodological limitations. These limitations include potential recall bias, low or unclear participation rates,
small sample sizes, and challenges in disentangling the effect of different measures, which were often
implemented at the same time.
To bridge these gaps and improve the understanding of SARS-CoV-2 infection among health workers, WHO has
developed a standardized protocol for COVID-19 surveillance among health workers that countries can use, and
is leading an international multi-centre case-control study primarily aimed at identifying risk factors and settings
of exposure. More than 140 sites in 28 countries have enrolled so far and recruitment is ongoing (for more
information please contact: earlyinvestigations-2019-nCoV@who.int).
Additionally, to mitigate health workers’ infections WHO has developed a health workers’ risk assessment and
management of exposure to COVID-19 cases and guidance on Prevention, identification and management of
health worker infection in the context of COVID-19.
WHO continues to support health workforce managers and policy makers with the December 2020 release of
Health workforce policy and management in the context of the COVID-19 pandemic response interim guidance,
consolidating the evolving evidence on the design, management and preservation of the workforce necessary
to respond to the COVID-19 pandemic and maintain essential health services.
Special Focus: Update on SARS-CoV-2 variants of concern
WHO, in collaboration with national authorities, institutions and researchers, continues to monitor the public
health events associated with SARS-CoV-2 variants and provides updates as new information
becomes available. Further information on the background of the variants of concern (VOC) is available from
previously published Disease Outbreak News and in the last four publications of the Weekly Epidemiological
Updates.
WHO continues to work with partners to evaluate available evidence around transmissibility, severity,
antibody neutralization capabilities and potential impacts on vaccines of specific mutations, variants of
interest and variants of concern. Here we provide an update on the geographical distribution of three variants
of concern as reported by countries, territories and areas (hereafter countries) as of 2 February 2021:
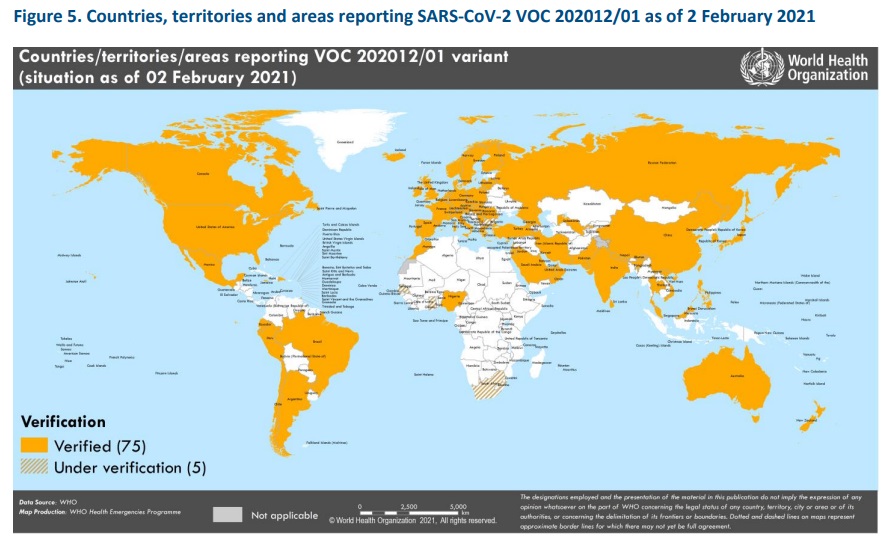
1. Variant VOC 202012/01, lineage B.1.1.7: Since our last update on 27 January, variant VOC 202012/01 has
been detected in ten additional countries. As of 2 February, a total of 80 countries across all six WHO regions
have reported either imported cases or community transmission of this variant (Figure 5).
2. Variant 501Y.V2, lineage B.1.351: Since the last update on 27 January, 501Y.V2 has been reported from ten additional countries– now totaling 41 countries across four of the six WHO regions (Figure 6).

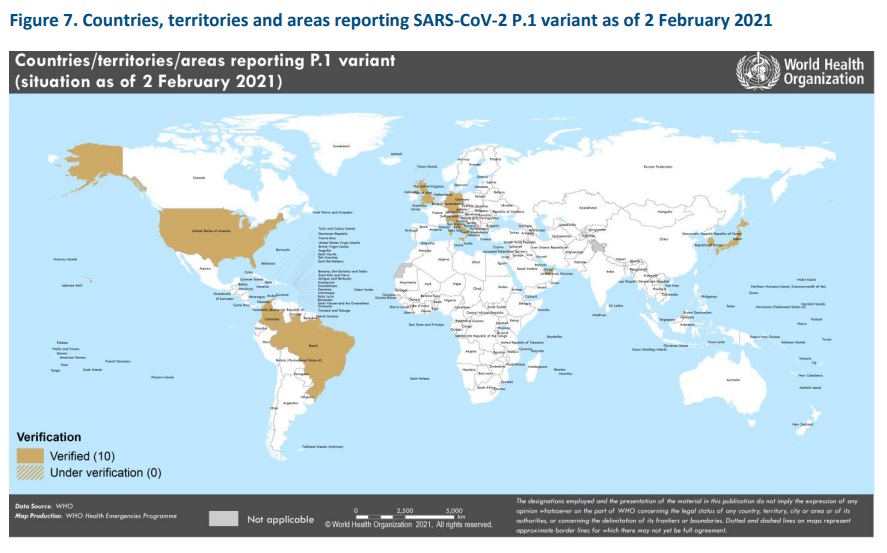
3. Variant P.1, lineage B.1.1.28: Since our last update, variant P.1 has been reported in two additional countries. To date, this variant is reported in ten countries across four of the six WHO regions (Figure 7).
Last week, WHO held a multidisciplinary Global Transmission Discussion Seminar on SARS-CoV-2 variants and transmission. Participants from Brazil, Denmark, South Africa and the United Kingdom presented ongoing work aiming to understand transmission aspects of the variants of concern emerging in their countries, namely variants: P.1/P.2, cluster 5, 501Y.V2 and VOC202012/01, respectively. Initial analyses suggest that some variants may be more transmissible, possibly due to mutations that improve the virus’s ability to bind to
human cells, but available studies have found that the modes of transmission have not changed.
SARS-CoV-2 incidence and hospitalizations in a number of countries where VOC202012/01 and 501Y.V2 are
circulating has started to decline in recent weeks, demonstrating the effectiveness of public health and social
measures for controlling transmission of these variants.
The emergence of new variants has highlighted the importance for everyone to continue to comply with local
and national public health and social measures, and to take simple precautions, such as physical distancing,
wearing a mask, keeping rooms well ventilated, avoiding crowds, cleaning your hands, and coughing into a
bent elbow or tissue (see also Protect yourself and others from COVID-19). It remains critical to increase diagnostic capacity and strategic genetic sequencing of SARS-CoV-2 where capacity allows, and continue to share
sequence data internationally in a timely manner. Genetic sequencing should be considered for a subset of
SARS-CoV-2 cases in each country, especially among outbreaks or clusters where transmission and/or severity
may appear unusual. WHO has recently issued guidance for SARS-CoV-2 suggesting how to apply the use
sequencing to monitor virus evolution in addition to epidemiological and virologic surveillance sequencing
(SARS-CoV-2 genomic sequencing for public health goals: Interim guidance; Genomic sequencing of SARS-CoV-2: a guide to implementation for maximum impact on public health).
Situation by WHO Region
African Region
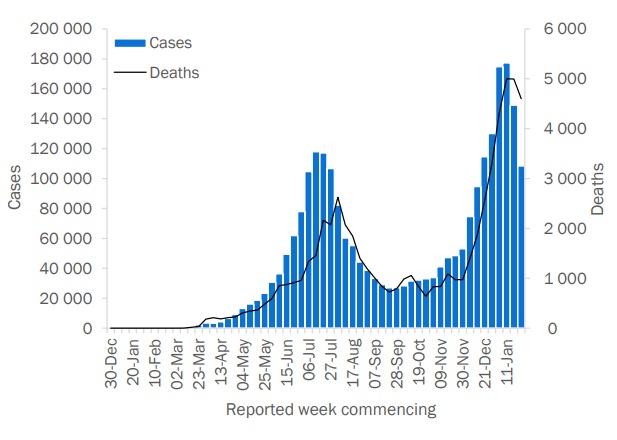
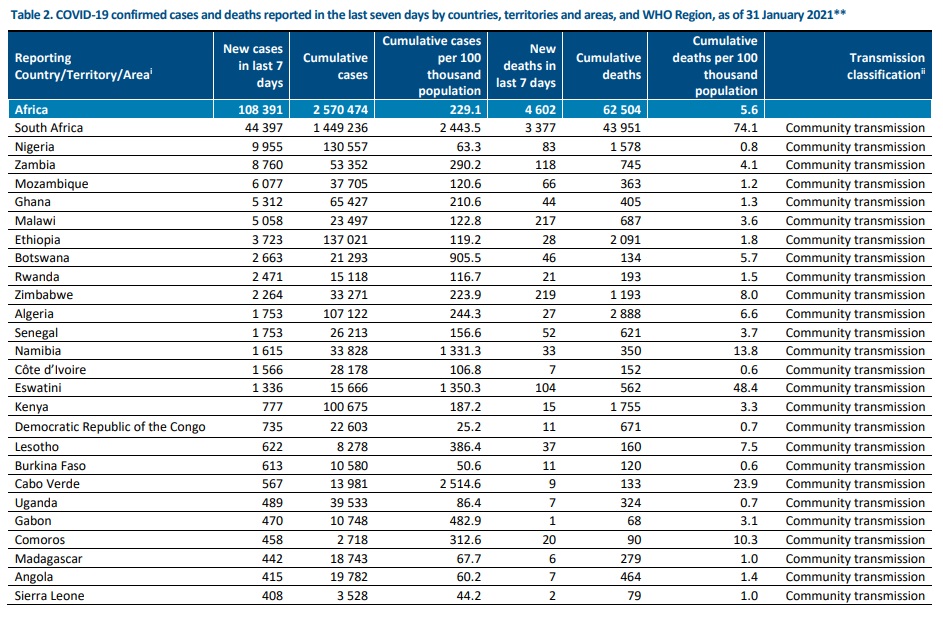
In the past week, the African Region reported over 108 000 cases and just over
4600 deaths, a 27% decrease in cases and an 8% decrease in deaths respectively
compared to the previous week. Cases have decreased for two consecutive weeks.
The highest numbers of new cases were reported in South Africa (44 397 new
cases; 74.9 new cases per 100 000 population; a 44% decrease), Nigeria (9955 new
cases; 4.8 new cases per 100 000; a 15% decrease) and Zambia (8760 new cases;
47.7 new cases per 100 000; a 3% increase).
The countries reporting the highest number of new deaths in the past week were
South Africa (3377 new deaths; 5.7 new deaths per 100 000; a 9% decrease),
Zimbabwe (219 new deaths; 1.5 new deaths per 100 000; a 25% decrease) and
Malawi (217 new deaths; 1.1 new deaths per 100 000; a 28% increase).
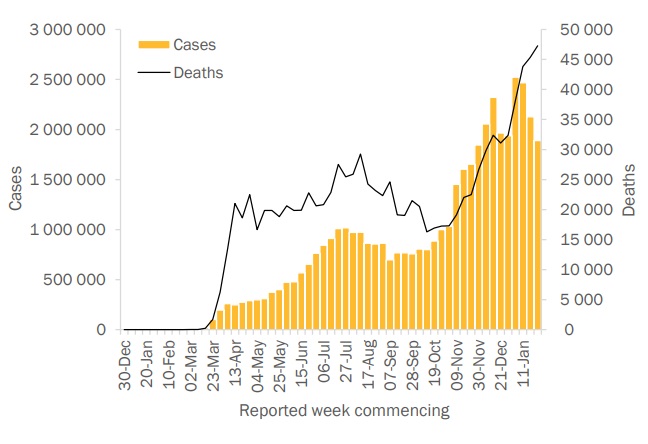
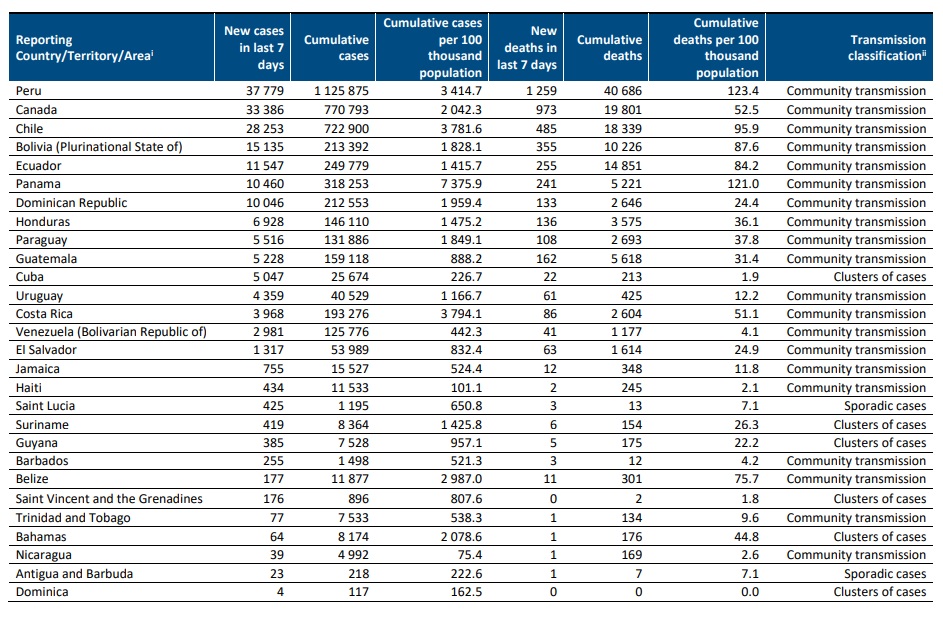
Region of the Americas
Over 1.8 million new cases and over 47 000 new deaths were reported in the
Region of the Americas this week, a decrease of 11% and an increase of 4%
respectively compared to the previous week. The highest numbers of new cases
were reported from the United States of America (1 072 287 new cases; 324.0 new
cases per 100 000 population; a 15% decrease), Brazil (364 593 new cases; 171.5
new cases per 100 000; a 1% increase) and Mexico (109 603 new cases; 85.0 new
cases per 100 000; an 11% decrease).
The highest numbers of deaths were reported from the same countries, the United
States of America (22 506 new deaths; 6.8 new deaths per 100 000; a 4% increase),
Mexico (8965 new deaths; 7.0 new deaths per 100 000; a 4% increase) and Brazil
(7423 new deaths; 3.5 new deaths per 100 000; a 6% increase).
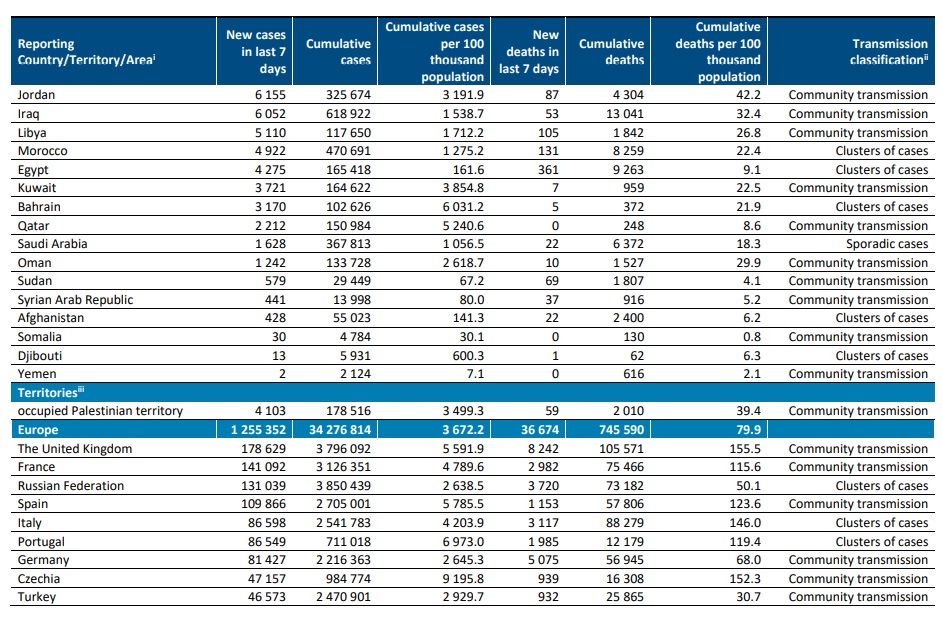
Eastern Mediterranean Region
In the past week, the Eastern Mediterranean Region reported over 161 000 new
cases, a decrease of 5% compared to last week. The region reported 3200 new
deaths, a 9% increase. The three countries reporting the highest numbers of new
cases continue to be the Islamic Republic of Iran (44 699 new cases, 53.2 new
cases per 100 000 population, a 5% increase), Lebanon (22 326
new cases, 327.1 new cases per 100 000, a 19% decrease) and United Arab Emirates
(26 285 new cases, 265.8 new cases per 100 000, 7% increase).
The highest numbers of new deaths were reported in Lebanon (751 new deaths, 11.0
new death per 100 000, an 81% increase), Iran (595 new deaths, 0.7 new death per
100 000 population, a 3% increase), and Tunisia (526 new deaths, 4.5 new death per
100 000, a 2% decrease).
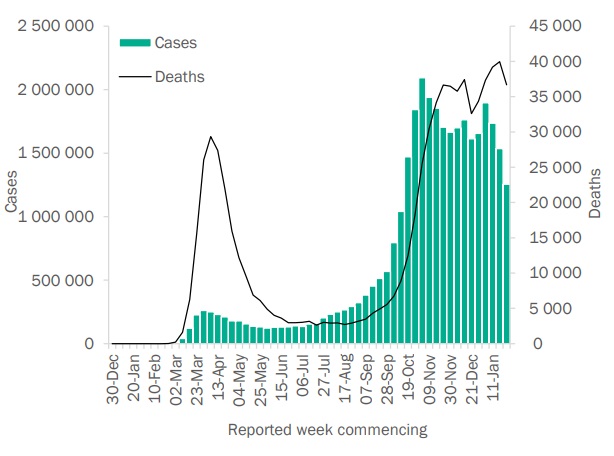
European Region
The European Region reported over 1.2 million new cases and over 36 000 new
deaths, a decrease of 18% and 8% respectively when compared to the previous
week. The three countries reporting the highest numbers of new cases were the
United Kingdom (178 629 new cases, 263.1 new cases per 100 000, a 31%
decrease), France (141 092 new cases; 216.2 new cases per 100 000, a 2%
increase) and the Russian Federation (131 039 new cases, 89.8 new cases per 100
000, a 13% decrease).
The highest numbers of deaths were reported from the United Kingdom (8242
new deaths; 12.1 new deaths per 100 000, a 6% decrease), Germany (5075 new
deaths; 6.1 new deaths per 100 000, a 7% decrease) and the Russian Federation
(3720 new deaths; 2.5 new deaths per 100 000, a 5% decrease).
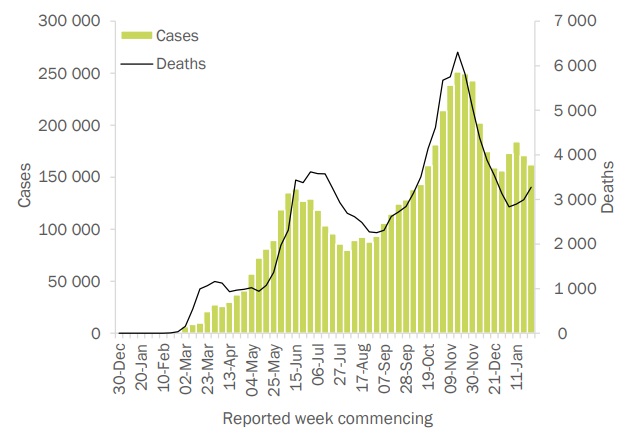
South-East Asia Region
Following slow declines in the number of new cases in the South-East Asia Region
in recent weeks, there was a plateau in newly reported cases (200 000 new
cases, 3% increase from last week), and deaths (3000 new deaths, 0% change)
this week. The three countries reporting the highest numbers of new cases and
new deaths were India (91 650 new cases; 6.6 new cases per 100 000, a 5%
decrease), Indonesia (88 839 new cases; 32.5 new cases per 100 000; a 10%
increase) and Sri Lanka (5706 new cases; 26.6 new cases per 100 000; an 8%
increase).
The three countries reporting the highest numbers of new deaths this week were
Indonesia (2064 new deaths; 0.8 new deaths per 100 000, a 9% increase), India
(935 new deaths; <0.1 new deaths per 100 000, a 12% decrease) and Bangladesh
(108 new deaths; <0.1 new deaths per 100 000; a 10% decrease).
Western Pacific Region
The Western Pacific Region reported 72 000 new cases the past week, an 11%
decrease compared the previous week, while a marked (21%) increase was
seen in the number of new deaths, with over 1200 deaths reported this week.
The three countries reporting the highest numbers of new cases in the region
this week were Malaysia (29 206 new cases; 90.2 new cases per 100 000, a
15% decrease), Japan (26 081 new cases; 20.6 new cases per 100 000, a 32%
decrease), and the Philippines (11 837 new cases; 10.8 new cases per 100
000, a 9% decrease).
The three countries reporting the highest numbers of new deaths this week
were Japan (635 new deaths; 0.5 new deaths per 100 000, an 8% increase),
the Philippines (479 new deaths; 0.4 new deaths per 100 000, an 11%
increase) and Malaysia (79 new deaths; 0.2 new deaths per 100 000, a 56%
increase).


South-East Asia Region
Data presented are based on official laboratory-confirmed COVID-19 case and deaths reported to WHO by
country/territories/areas, largely based upon WHO case definitions and surveillance guidance. While steps are
taken to ensure accuracy and reliability, all data are subject to continuous verification and change, and caution
must be taken when interpreting these data as several factors influence the counts presented, with variable
underestimation of true case and death incidence, and variable delays to reflecting these data at global level. Case
detection, inclusion criteria, testing strategies, reporting practices, and data cut-off and lag times differ between
countries/territories/areas. A small number of countries/territories/areas report combined probable and
laboratory-confirmed cases. Differences are to be expected between information products published by WHO,
national public health authorities, and other sources. Due to public health authorities conducting data
reconciliation exercises which remove large numbers of cases or deaths from their total counts, negative numbers
may be displayed in the new cases/deaths columns as appropriate. When additional details become available that
allow the subtractions to be suitably apportioned to previous days, graphics will be updated accordingly. See the
log of major changes and errata for details. Prior situation reports will not be edited; see covid19.who.int for the
most up-to-date data.
Global totals include 745 cases and 13 deaths reported from international conveyances.
The designations employed, and the presentation of these materials do not imply the expression of any
opinion whatsoever on the part of WHO concerning the legal status of any country, territory or area or of its
authorities, or concerning the delimitation of its frontiers or boundaries. Dotted and dashed lines on maps
represent approximate border lines for which there may not yet be full agreement. Countries, territories and
areas are arranged under the administering WHO region. The mention of specific companies or of certain
manufacturers’ products does not imply that they are endorsed or recommended by WHO in preference to
others of a similar nature that are not mentioned. Errors and omissions excepted, the names of proprietary
products are distinguished by initial capital letters.
[1] All references to Kosovo should be understood to be in the context of the United Nations Security Council
resolution 1244 (1999). In the map, number of cases of Serbia and Kosovo (UNSCR 1244, 1999) have been
aggregated for visualization purposes.
i Excludes countries, territories, and areas that have never reported a confirmed COVID-19 case.
ii Transmission classification is based on a process of country/territory/area self-reporting. Classifications are
reviewed on a weekly basis and may be revised as new information becomes available. Differing degrees of
transmission may be present within countries/territories/areas. For further information, please see:
Considerations for implementing and adjusting public health and social measures in the context of COVID-19:
• No (active) cases: No new cases detected for at least 28 days (two times the maximum incubation period), in
the presence of a robust surveillance system. This implies a near-zero risk of infection for the general
population.
• Imported / Sporadic cases: Cases detected in the past 14 days are all imported, sporadic (e.g., laboratory
acquired or zoonotic) or are all linked to imported/sporadic cases, and there are no clear signals of further
locally acquired transmission. This implies minimal risk of infection for the general population.
• Clusters of cases: Cases detected in the past 14 days are predominantly limited to well-defined clusters that
are not directly linked to imported cases, but which are all linked by time, geographic location and common
exposures. It is assumed that there are a number of unidentified cases in the area. This implies a low risk of
infection to others in the wider community if exposure to these clusters is avoided.
• Community transmission: Which encompasses a range of levelsfrom low to very high incidence, as described
below and informed by a series of indicators described in the aforementioned guidance. As these
subcategorization are not currently collated at the global level, but rather intended for use by national and
sub-national public health authorities for local decision-making, community transmission has not been
disaggregated in this information product.
o CT1: Low incidence of locally acquired, widely dispersed cases detected in the past 14 days, with many of
the cases not linked to specific clusters; transmission may be focused in certain population sub-groups.
Low risk of infection for the general population.
o CT2: Moderate incidence of locally acquired, widely dispersed cases detected in the past 14 days;
transmission less focused in certain population sub-groups. Moderate risk of infection for the general
population.
o CT3: High incidence of locally acquired, widely dispersed cases in the past 14 days; transmission
widespread and not focused in population sub-groups. High risk of infection for the general population.
o CT4: Very high incidence of locally acquired, widely dispersed cases in the past 14 days. Very high risk of
infection for the general population.
• Pending: transmission classification has not been reported to WHO.
“Territories” include territories, areas, overseas dependencies and other jurisdictions of similar status.
About WHO
The World Health Organization provides global leadership in public health within the United Nations system. Founded in 1948, WHO works with 194 Member States, across six regions and from more than 150 offices, to promote health, keep the world safe and serve the vulnerable. Our goal for 2019-2023 is to ensure that a billion more people have universal health coverage, to protect a billion more people from health emergencies, and provide a further billion people with better health and wellbeing.