Union Ministry of Health and Family Welfare today hosted a high-level panel discussion on the theme “Scaling AI for Public Health Impact: Public-Private Partnership” as part of the India AI Impact Summit 2026 at Bharat Mandapam.
The Government of India is hosting the India AI Impact Summit 2026 from 16th to 20th February 2026 at Bharat Mandapam, New Delhi, marking the first-ever global AI summit to be held in the Global South. The Summit brings together global leaders, policymakers, industry experts, academia, and innovators to deliberate on the transformative potential of Artificial Intelligence (AI) across sectors, with a special emphasis on inclusive and sustainable development.
As a key participating Ministry, Ministry of Health and Family Welfare is playing a significant role in the Summit through a high-level panel discussion, the launch of key initiatives, and the showcasing of AI-driven healthcare solutions at its dedicated exhibition stall.
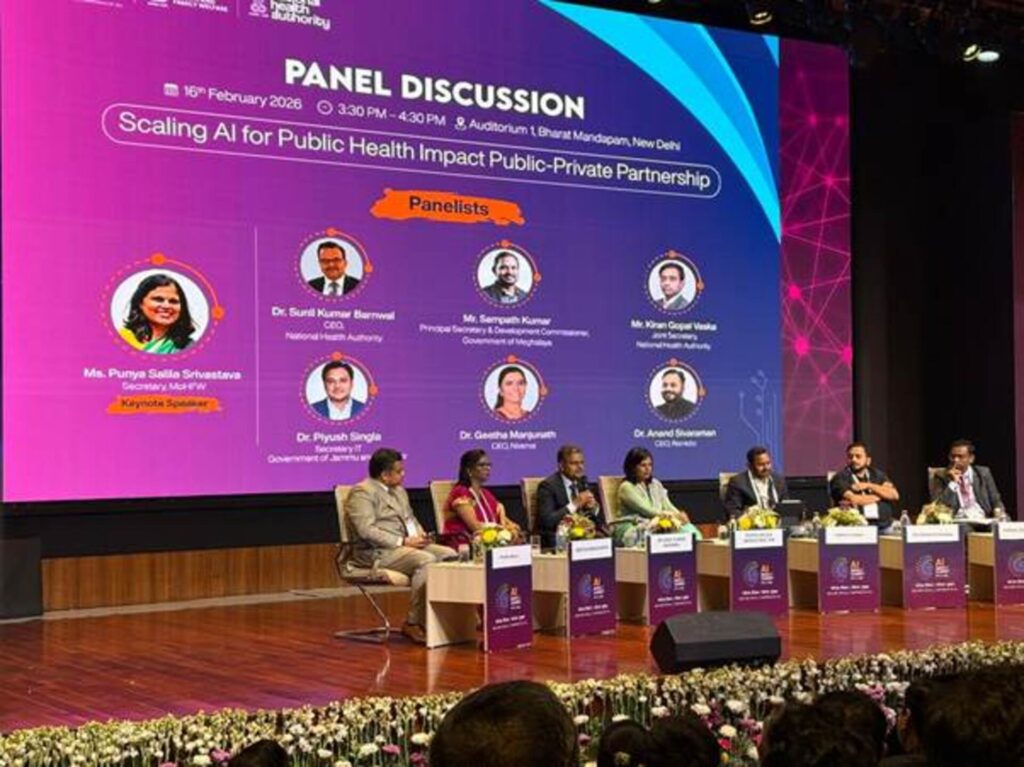
Delivering the keynote address, Union Health Secretary Smt. Punya Salila Srivastava stated that over the past decade, India’s health system has transitioned from basic digitisation of records and improved data reporting to building a nationally interoperable digital health ecosystem. She recalled that the National Health Policy set the vision of achieving the highest attainable standard of health and well-being for all citizens, which was further operationalised through the National Digital Health Blueprint by promoting open standards, interoperability, privacy-by-design, and the adoption of emerging technologies including Generative AI.
She highlighted that the Ayushman Bharat Digital Mission (ABDM) has evolved into a robust digital public infrastructure for health, with over 859 million ABHA accounts linked to more than 878 million health records. With more than 1.80 lakh Ayushman Arogya Mandirs operational across the country, digital platforms are being integrated at the primary care level. E-Sanjeevani, powered by AI-assisted Clinical Decision Support Systems (CDSS), has enabled over 449 million teleconsultations through more than 2.2 lakh registered healthcare providers, making it the world’s largest telemedicine initiative in primary healthcare.

Emphasising that digital systems enabled the capture and transmission of information while AI enables its intelligent interpretation and action, she noted that AI has the potential to reduce the burden on the healthcare workforce while strengthening — not replacing — the physician–patient relationship. Citing examples, she referred to MadhuNetrAI for AI-based diabetic retinopathy screening, AI-enabled handheld X-rays and acoustic screening tools such as Cough Against TB (CA-TB) for tuberculosis detection, and AI-integrated surveillance systems for faster epidemic alerts. She also highlighted the establishment of Centres of Excellence for AI in healthcare at AIIMS Delhi, PGIMER Chandigarh, and AIIMS Rishikesh.
Stressing the importance of collaboration, the Union Health Secretary invited industry and State representatives to share their experiences on working with government systems, improving procurement and data frameworks, and identifying AI solutions most useful in field settings. She underscored that under the leadership of Hon’ble Prime Minister Narendra Modi, India’s emphasis on digital public infrastructure as a tool for inclusion and equity continues to guide its digital health and AI journey, aligned with the vision of Viksit Bharat @2047.

Addressing the gathering, Dr. Sunil Kumar Barnwal, CEO, National Health Authority, stated that Artificial Intelligence can significantly enhance efficiency in healthcare delivery and enable faster, data-driven decision-making, particularly in large-scale public health programmes. He emphasised that AI-powered analytics can strengthen beneficiary identification, streamline claims management, detect fraud, and monitor service utilisation, thereby improving transparency, accountability, and overall system performance.
He further underscored the importance of building interoperable digital platforms supported by strong data governance and privacy safeguards to ensure responsible deployment of AI solutions. Highlighting the scale and complexity of national health schemes, he noted that technology-driven innovations are essential to optimise resource allocation, improve targeting of services, and achieve better health outcomes across the country.

The panel brought together eminent representatives from government, industry, multilateral organizations, and the start-up ecosystem to deliberate on scaling AI innovations for public health impact. Discussions focused on leveraging AI for predictive analytics, early disease detection, telemedicine, health data management, and real-time monitoring of public health programmes.
The Ministry is also showcasing its digital health and AI initiatives at the India AI Impact Expo 2026 at Stall No. 1.63 and 1.64, Hall 1, Bharat Mandapam. These include an AI-powered Clinical Decision Support System (CDSS), which enables structured, multilingual symptom capture through a patient assistance form and supports accurate, confident, and data-driven clinical decision-making.
The showcase also features BODH (Benchmarking Open Data Platform for Health AI), developed by IIT Kanpur in collaboration with the National Health Authority, to enable the evaluation of AI models on diverse real-world datasets prior to population-scale deployment, thereby promoting trustworthy and responsible innovation in health AI. The platform will be formally launched tomorrow, on 17th February, by Union Health Minister Shri Jagat Prakash Nadda.
Other initiatives on display include a Voice-to-Text AI model that converts a doctor’s voice into a digital prescription, seamlessly integrated into the existing HMIS workflow, and an AI-powered media surveillance system designed to generate early warning signals for disease outbreaks.
The India AI Impact Summit 2026 is expected to serve as a catalyst for collaborative action and knowledge exchange, enabling cross-sectoral partnerships to harness AI for public good. Through its active engagement in the Summit, the Ministry of Health and Family Welfare reiterates its commitment to leveraging cutting-edge technologies to strengthen public health systems and ensure accessible, affordable, and quality healthcare for all.
An Industry Interaction on the theme “Scaling up Pharma Exports” was held under the Chintan Shivir series being taken forward under the guidance of Prime Minister Shri Narendra Modi. The interaction reflected the Government’s priority of expanding India’s export footprint through closer coordination with industry and regulators.
India’s pharmaceutical export performance continues to show steady growth. Pharmaceutical exports stood at USD 30.47 billion in FY 2024–25, registering a growth of 9.4 per cent over the previous year. The sector, currently valued at around USD 60 billion, is projected to reach USD 130 billion by 2030. India ranks third globally by volume, with medicines exported to over 200 markets, and more than 60 per cent of exports destined for stringent regulatory markets. The United States accounts for 34 per cent and Europe for 19 per cent of India’s pharmaceutical exports. The interaction underlined the Government’s focus on enabling conditions for sustained export acceleration, with industry indicating readiness to target double-digit growth in 2026–27.
The programme commenced with a video message from the Commerce Secretary, Department of Commerce, who emphasised the importance of sustained engagement with exporters and manufacturers and timely response to challenges in regulated markets. The message reiterated the Prime Minister’s emphasis on strengthening India’s standing as a trusted trade partner, expanding its share in global pharmaceutical markets and ensuring that affordable and high-quality medicines from India continue to reach people across the world.
The inaugural session witnessed participation from the Department of Commerce, Directorate General of Foreign Trade (DGFT), Central Drugs Standard Control Organisation (CDSCO) and the Food and Drugs Control Administration, alongside industry stakeholders. Discussions focused on regulatory processes, export facilitation and alignment between policy measures and the next phase of sectoral growth, particularly for Micro, Small and Medium Enterprises (MSMEs), which often face significant compliance, documentation and inspection-related requirements.
The interaction also took note of the direction set in the Union Budget 2026–27, which places biopharma and biologics at the centre of India’s future healthcare and manufacturing priorities. The proposed Biopharma SHAKTI initiative, with an outlay of ₹10,000 crore over five years, aims to strengthen India’s end-to-end ecosystem for biologics and biosimilars, reduce import dependence and enhance competitiveness in global supply chains, aligned with the objective of capturing 5 per cent of the global biopharmaceutical market share.
In this context, the proposal to establish three new National Institutes of Pharmaceutical Education and Research (NIPERs), upgrade seven existing NIPERs, develop over 1,000 accredited clinical trial sites and strengthen CDSCO capacity through induction of specialised scientific and technical personnel was discussed in terms of enabling faster evaluation of complex products and enhancing confidence in India’s regulatory framework.
Panel discussions and thematic sessions examined the export journey from manufacturing discipline to market acceptance. Sessions such as “Scaling Excellence through Entrepreneurial Journey,” “From Commodity Supplier to Trusted Global Partner,” “Vriddhi Ka Mantra – Growth Ka Yantra,” and “Scale Up Mantra for Emerging Companies” focused on strategies for the next decade of pharmaceutical exports. Participants shared practical experiences on strengthening quality systems, ensuring compliance readiness and moving up the value chain, while maintaining reliability in cost and supply.
Exporters were also apprised of opportunities arising from recent trade engagements with key partners, including the European Union and the United States. It was noted that closer economic arrangements can provide clearer pathways for market access and steadier demand, particularly in large, regulated markets. Engagement with the European Union was discussed in the context of a USD 572.3 billion pharmaceuticals and medical devices market, while a bilateral trade arrangement with the United States can further improve market access and price competitiveness for Indian pharmaceutical companies.
A presentation on the activities of the Pharmaceuticals Export Promotion Council of India (PHARMEXCIL) and the 12th International Exhibition on Pharma and Healthcare Industry (iPHEX) was made, followed by an open interaction with exporters and stakeholders. Around 200 exporters, largely from the western region of India, participated in the programme.
The discussions in Ahmedabad maintained focus on key priorities for exporters and the wider public, including faster and more predictable approvals, strengthened regulatory cooperation and a steady shift from volume-driven exports to higher-value segments such as biologics, biosimilars and innovation-driven products. The Department of Commerce will continue engagement with exporters, regulators and Indian Missions abroad to ensure timely identification and resolution of issues, thereby supporting sustained growth in India’s pharmaceutical exports in global markets.
Union Minister of Commerce and Industry Shri Piyush Goyal addressed the Plenary Session of the India–Brazil Business Forum in New Delhi, highlighting the expanding cooperation between India and Brazil across sectors. Referring to the growth in bilateral trade by 25 per cent in the past year to reach USD 15 billion, he described the current level as suboptimal and called for greater ambition in further strengthening economic engagement between the two countries.
Referring to higher benchmarks set by President Luiz Inácio Lula da Silva and Prime Minister Narendra Modi, he expressed confidence that both nations can grow faster, grow bigger and grow together for shared prosperity. Highlighting the India–Brazil partnership, the Minister described the two countries as natural partners, bound by democracy, diversity and shared aspirations for development. He observed that the relationship has evolved into a strong and multifaceted strategic partnership driven by people-to-people ties and expanding cooperation across sectors. Brazil is India’s largest trading partner in the Latin America and Caribbean region, with bilateral engagement deepening in defence, energy, agriculture and agrochemicals.
Shri Goyal also emphasised the broader dimensions of the partnership, including South-South cooperation and collaboration under BRICS, IBSA, the G20 and the World Trade Organization (WTO). He expressed confidence in the bright future of bilateral ties.
Referring to India’s trade strategy, the Minister highlighted India’s emergence as a trusted and reliable destination for global business and investment, attracting nearly USD 80 billion in foreign direct investment in financial year 2025, the highest ever in a single year. He stated that India has recently concluded a series of high-quality Free Trade Agreements and is actively negotiating several more. With these agreements, India now enjoys preferential access to nearly two-thirds of global trade. He informed that terms of reference have been finalised with Israel and the Gulf Cooperation Council (GCC), discussions have been launched with Canada, and negotiations are expected to commence in the near future.
He underlined the importance of the MERCOSUR region and stated that India is working to expand the India–MERCOSUR Preferential Trade Agreement to enhance market access, promote investments, foster technology partnerships and strengthen engagement in sports, education and culture.
Shri Goyal noted that the engagement comes at a time when both economies are experiencing renewed momentum. He stated that India is currently the world’s fastest-growing major economy, with real GDP growth in the second quarter exceeding 8 per cent. He added that India is on track to surpass Germany within the next two years to become the world’s third-largest economy. This growth, he said, reflects structural transformation since 2014, driven by reforms in taxation, logistics, manufacturing, digital infrastructure, compliance reduction and ease of doing business. He further noted that India actively promotes outward investment and that Free Trade Agreements will play a critical role in enabling Indian industry to expand both domestically and internationally.
Describing Brazil’s strengths, Shri Goyal referred to its rich natural resources, including niobium, lithium and iron ore, which are vital for the global energy transition and emerging technologies. He also highlighted Brazil’s strengths in agriculture, aerospace, automotive and digital technologies, identifying these as areas of significant collaboration. He stated that India and Brazil together have the potential to reshape global value chains through resources, innovation and a forward-looking vision, and invited Brazilian companies to partner with India in co-creating jobs, adding value and leveraging technology.
The Minister reaffirmed the shared commitment of both countries to safeguarding national interests and promoting equitable access within global intellectual property frameworks, particularly in protecting indigenous technologies. He recalled that during the State Visit of Prime Minister Narendra Modi to Brazil in July 2025, both Prime Minister Modi and President Luiz Inácio Lula da Silva agreed to deepen the India–Brazil strategic partnership.
Concluding his address, Shri Goyal expressed confidence that the present engagement would provide an opportunity to chart a forward-looking agenda and further strengthen bilateral strategic cooperation. He called for nurturing a stronger India–Brazil partnership through collaboration and innovation, with a shared vision of mutual prosperity in the years ahead.
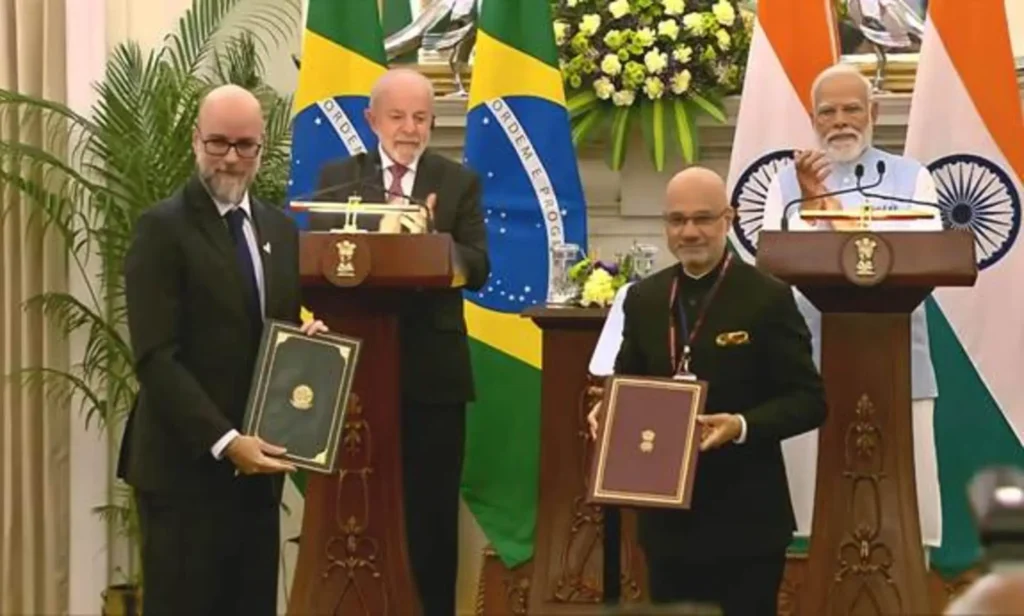
India and Brazil today exchanged a Memorandum of Understanding (MoU) to strengthen bilateral cooperation in the field of regulation of pharmaceutical and medical products. The MoU was exchanged between India’s Central Drugs Standard Control Organisation (CDSCO) and Brazilian Health Regulatory Agency (ANVISA), marking an important step towards deeper regulatory collaboration between the two countries. Director-President of ANVISA, Mr. Leandro Safatle and Indian Ambassador to Brazil, Shri Dinesh Bhatia exchanged the MoU today in Hyderabad House in the august presence of Shri Narendra Modi, Prime Minister of India and H.E. Luiz Inácio Lula da Silva, President of Brazil.

The MoU establishes a structured framework for cooperation and exchange of information in the field of medical products, including pharmaceutical ingredients, drugs, biological products and medical devices. It aims to promote convergence in regulatory practices, enhance mutual understanding of regulatory systems and facilitate effective and coordinated oversight of medical products.
The exchange of the MoU reflects the shared commitment of India and Brazil to ensuring the availability of safe, effective and quality-assured medicines and medical products for their populations. The agreement is also expected to contribute to strengthening supply chains, encouraging regulatory best practices and supporting access to affordable healthcare solutions.
The MoU between CDSCO and ANVISA builds upon the broader India–Brazil cooperation in the health sector and complements existing institutional mechanisms for bilateral engagement. It underscores the growing collaboration between the two countries in health, pharmaceuticals and medical technologies, particularly in the context of their shared priorities as leading Global South partners.
Through this MoU, both sides reaffirmed their intent to work closely in areas such as information sharing, regulatory capacity building, and cooperation in matters related to pharmaceutical and medical product regulation, in accordance with their respective national laws and regulations.
The exchange of the MoU is expected to further strengthen India–Brazil relations and open new avenues for collaboration in the health and pharmaceutical sectors, contributing to improved public health outcomes in both countries.
We have noted the US Supreme Court judgement on tariffs yesterday. President Trump has also addressed a press conference in that regard. Some steps have been announced by the US Administration. We are studying all these developments for their implications.
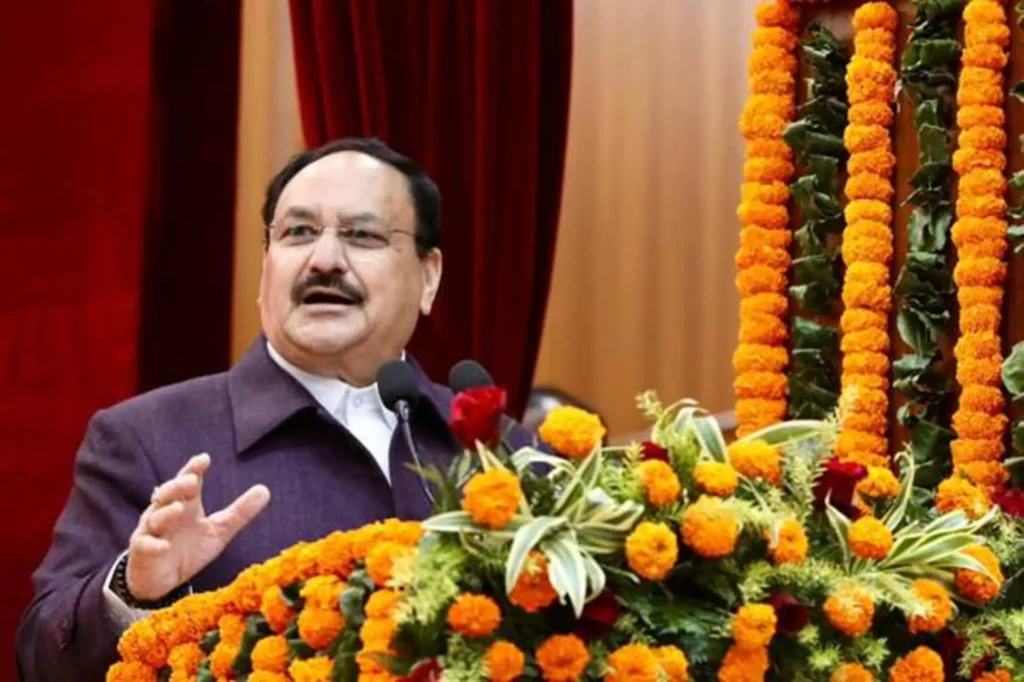
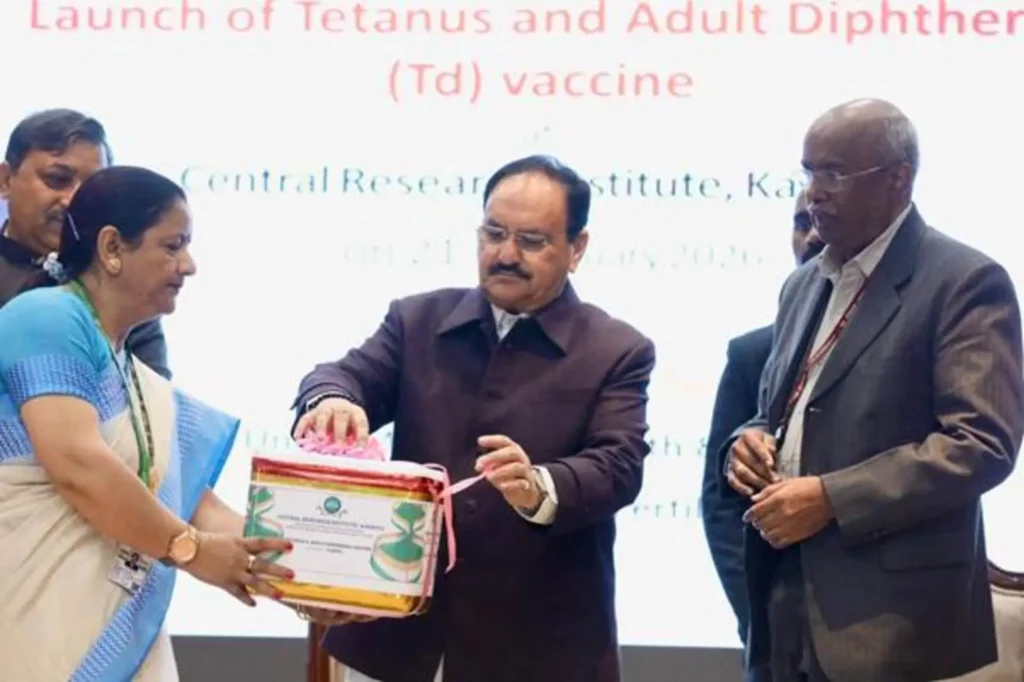
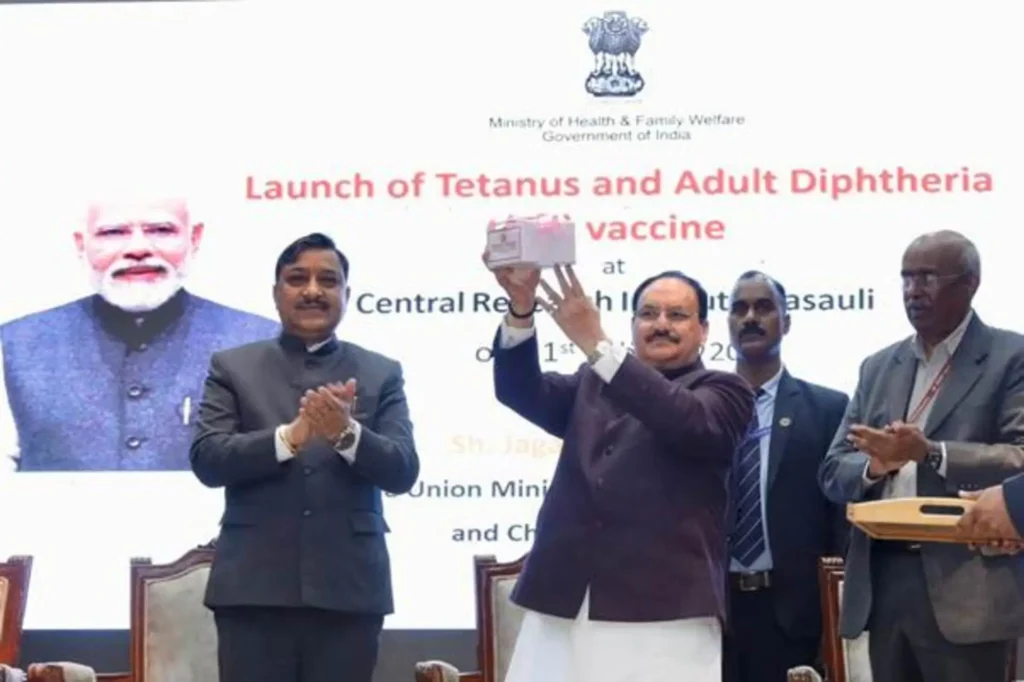
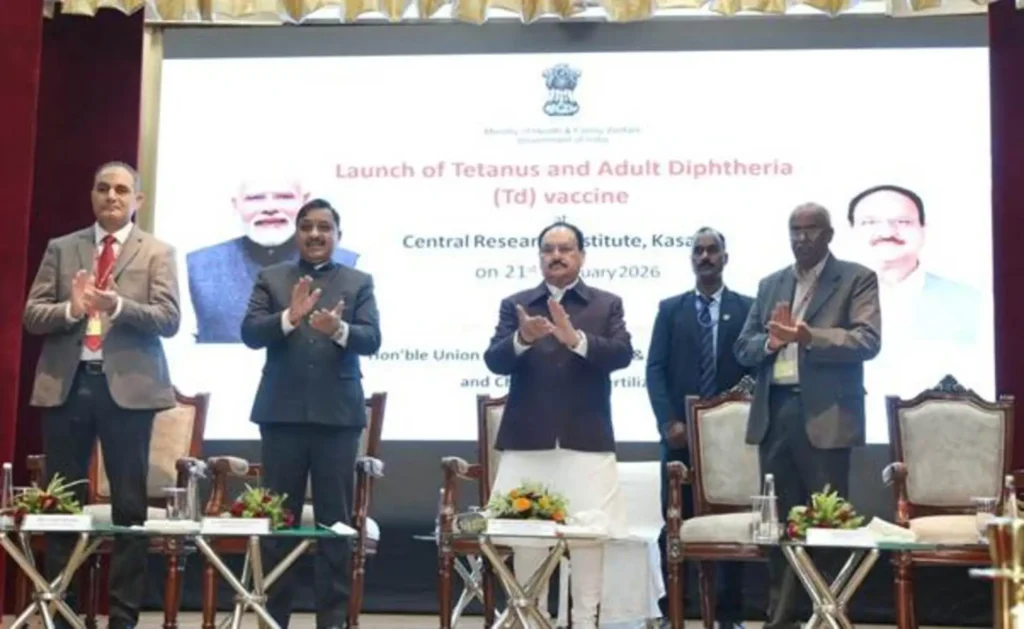
Union Minister for Health and Family Welfare Shri J.P. Nadda today launched the indigenously manufactured Tetanus and Adult Diphtheria (Td) Vaccine at the Central Research Institute (CRI), Kasauli in Himachal Pradesh.
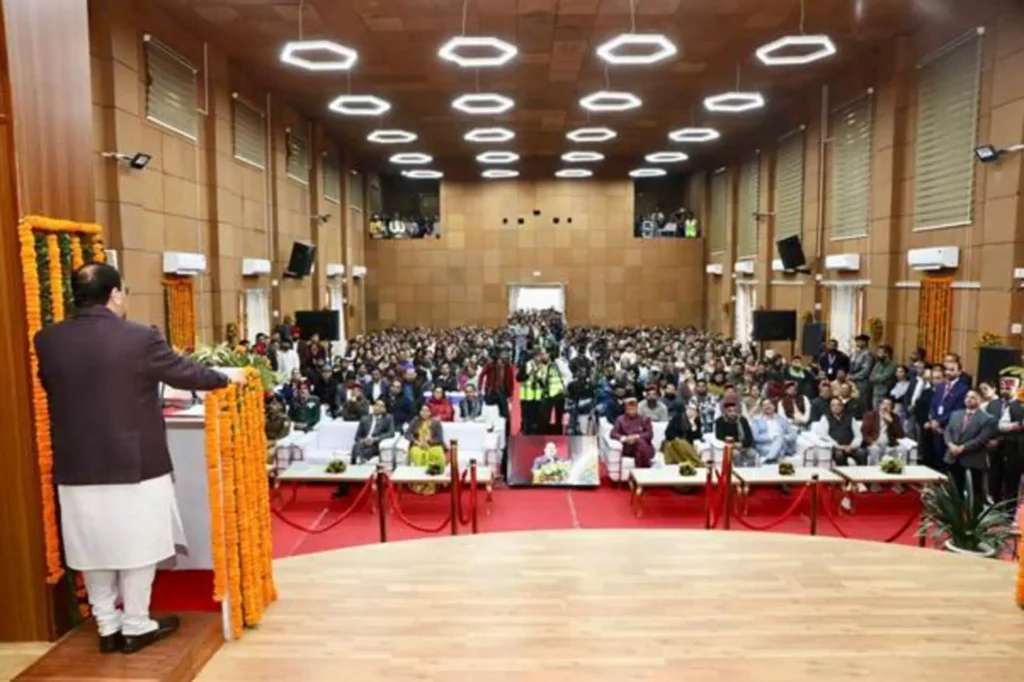
Addressing the gathering, Union Health Minister Jagat Prakash Nadda congratulated the scientists, technical experts and staff of the Central Research Institute (CRI), Kasauli, describing the indigenous launch of the Tetanus and Adult Diphtheria (Td) vaccine as a momentous and historic occasion. He stated that the launch marks a significant step towards safeguarding national health security and strengthening India’s public health infrastructure.
The Minister underlined that the Government, under the leadership of Prime Minister Narendra Modi, has set clear targets for achieving self-reliance in the health and pharmaceutical sectors. He noted that the launch of the indigenously manufactured Td vaccine represents a concrete step towards the vision of Atmanirbhar Bharat in health and medicine.
With the formal launch of the Td vaccine , the vaccine has now been introduced for supply under the Universal Immunization Programme (UIP). The Central Research Institute will supply 55 lakh doses to the UIP by April 2026, with production expected to scale up progressively in subsequent years to further strengthen the Universal Immunization Programme of the Government of India, he stated.
Highlighting India’s global standing, the Minister also stated that India is widely recognized as the “pharmacy of the world” and is among the leading vaccine manufacturers globally. He further noted that India has achieved Maturity Level 3 in the World Health Organization’s global benchmarking of regulatory systems, reflecting the robustness of its vaccine regulatory framework. Institutions such as CRI, he observed, have played a significant role in achieving these standards.
Union Health Minister recalled that historically, vaccine and drug development timelines were long—tetanus vaccine development took decades globally, tuberculosis medicines took nearly 30 years to evolve, and the Japanese Encephalitis vaccine took almost a century of scientific effort. In contrast, during the COVID-19 pandemic, India developed two indigenous vaccines within nine months and administered over 220 crore doses, including booster doses. He also highlighted that COVID-19 vaccination certificates were delivered digitally, demonstrating India’s digital transformation in public health delivery.
Referring to India’s global solidarity efforts, he stated that under the Vaccine Maitri initiative, India supplied vaccines to nearly 100 countries, of which 48 countries received vaccines free of cost. He noted that the contributions of public sector institutions such as CRI strengthened India’s capacity to serve both domestic and global needs.
Shri Nadda emphasized that CRI is the first government institute to manufacture vaccines under Good Manufacturing Practices (GMP) standards, reflecting the modernization and revitalization of public sector vaccine manufacturing units.
Highlighting the Universal Immunization Programme (UIP), he described it as the world’s largest immunization programme. The UIP currently provides 11 vaccines protecting against 12 vaccine-preventable diseases, in which CRI has made substantial contributions. He noted that every year approximately 2 to 2.5 crore children are born and a similar number of women become pregnant. From the time of pregnancy registration, beneficiaries are tracked through digital platforms such as U-WIN. The Government ensures that expectant mothers receive five antenatal check-ups, including at least one by a specialist. The immunization and tracking process continues until the child attains 16 years of age, covering 27 doses under the programme.
The Minister informed that the annual immunization cohort comprises nearly 5 crore beneficiaries, including around 2.5 crore pregnant women and 2.5 crore children. Due to systematic tracking and sustained immunization efforts, vaccine coverage in the country has reached nearly 99 percent. He described this as a transformative shift in India’s public health landscape, with institutions like CRI playing a pivotal role.
Referring to Ayushman Bharat - Pradhan Mantri Jan Arogya Yojana, the Minister stated that it is the world’s largest publicly funded health coverage programme, benefitting over 62 crore people. He further noted that all citizens above 70 years of age, irrespective of socio-economic criteria, are eligible for health coverage of up to ₹5 lakh per year under the scheme.
The Minister also highlighted improvements in institutional deliveries, which have increased from 79 percent to 89 percent, reflecting strengthened maternal health services and improved access to healthcare facilities across the country.
He reiterated that such policy interventions and institutional strengthening demonstrate how sustained governance efforts can transform public health outcomes and reinforce national health security.
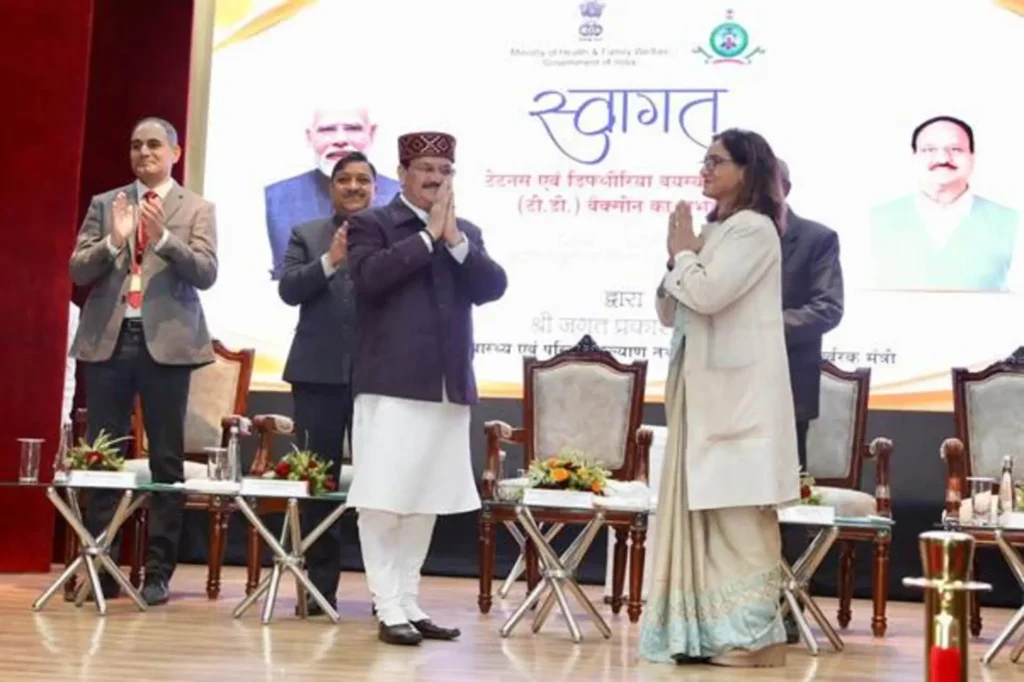
Senior officials from the Ministry of Health and Family Welfare, representatives of State Health Departments, Dr. Dimple Kasana, Director, Central Research Institute, Kasauli, public health experts, and other stakeholders were present at the occasion.
Background
In view of this in 2006, the World Health Organization (WHO) recommended that countries transition from Tetanus Toxoid (TT) vaccine to Td vaccine. This recommendation was reaffirmed in the WHO Tetanus Vaccine Position Paper (2017) and through deliberations of the Strategic Advisory Group of Experts (SAGE) in 2002 and 2016.
The National Technical Advisory Group on Immunization (NTAGI), Ministry of Health & Family Welfare, has also recommended replacing the TT vaccine with the Td vaccine in India’s immunization programme for all age groups, including pregnant women. This transition aims to extend and strengthen protection against diphtheria in addition to tetanus, while sustaining the gains achieved in maternal and neonatal tetanus elimination and routine immunization activities.
To support this initiative, CRI has undertaken the manufacturing of the Td vaccine. The Institute successfully completed developmental studies, obtained a Test License, secured waivers for preclinical studies and Phase I, II, and III clinical trials, received Marketing Authorization and License for manufacture and sale, initiated commercial manufacturing, and obtained release from the Central Drugs Laboratory, Kasauli.
The Production Linked Incentive (PLI) Scheme, with an incentive outlay of ₹1.91 lakh crore, represents a strategic reform initiative aimed at strengthening India’s manufacturing base. With 836 applications approved across 14 strategic sectors, the Scheme reflects strong industry confidence and robust adoption. Since its launch, the PLI Scheme has demonstrated sustained uptake by industry and consistent expansion of manufacturing capacity.
As on 31 December 2025, the cumulative performance under the Scheme is as follows:
These outcomes indicate sustained momentum in investment inflows, production expansion, export growth and employment generation across targeted sectors.
The positive impact of the Scheme across key sectors is summarized below:
Electronics Manufacturing & IT Hardware
The PLI Scheme has strengthened India’s electronics manufacturing ecosystem, positioning the country as a major hub for mobile phones and IT hardware products such as laptops, tablets, servers and all-in-one personal computers. Mobile phone imports have declined by nearly 77 per cent since FY 2020–21, while over 99 per cent of domestic demand is now met through local production. Manufacturing has expanded beyond assembly to include printed circuit board assemblies, batteries, camera and display modules, enclosures and other critical sub-assemblies, enabling deeper integration with global value chains. Domestic manufacturing capacity for IT hardware has also expanded, with progressive localisation of components reducing dependence on imports.
Pharmaceuticals & Medical Devices
The Scheme has enabled first-time domestic manufacturing of 191 bulk drugs, resulting in import substitution of approximately ₹1,785 crore and increasing domestic value addition to 83.7 per cent. Indigenous development of biosimilars, monoclonal antibodies and new chemical entities has strengthened pharmaceutical exports and supply chain resilience. Indigenous manufacturing of medical devices such as imaging systems, implants and diagnostic equipment has reduced import dependence through adoption of globally benchmarked quality systems.
Automobiles and Advanced Automotive Technology
The Scheme has catalysed investments in electric mobility, power electronics and advanced safety systems. Reported sales of ₹32,879 crore in FY 2025–26 indicate early momentum in technology-led automotive manufacturing and supplier ecosystem development.
Telecom and Networking Products
Sales of telecom and networking products have increased more than six-fold over the base year (FY 2019–20), while exports have risen to ₹21,033 crore. A significant milestone has been the deployment of India’s indigenous end-to-end 4G technology stack by BSNL, positioning India among a select group of countries with such capability.
Food Processing
PLI has catalysed investments of over ₹9,200 crore across approved projects. Adoption of advanced technologies such as ARBBM spice processing systems, Tetra Recart packaging and automated seafood processing equipment has enhanced efficiency, quality and export readiness.
White Goods – Air Conditioners and LED Lights
Domestic manufacturing has commenced for critical components including compressors, motors, copper tubes and LED drivers. Domestic value addition is targeted to increase to 75–80 per cent by 2028–29, strengthening the component ecosystem.
Textiles – MMF and Technical Textiles
The Scheme has supported a shift towards high-value man-made fibre and technical textile products, with integration of PM MITRA Parks enabling scale manufacturing and improved logistics.
High Efficiency Solar PV Modules
Under Tranche I and II, the Scheme targets 48 GW of fully integrated solar PV manufacturing capacity, with investment commitments of nearly ₹52,942 crore, significantly reducing import dependence in the renewable energy sector.
From a phase of relatively higher import dependence, India’s manufacturing ecosystem is witnessing progressive strengthening of domestic capabilities, with the Production Linked Incentive (PLI) Scheme contributing to this transition. Supported by sustained investment, expansion of production capacity, growth in exports and employment generation, the Scheme has emerged as an important policy instrument for enhancing manufacturing competitiveness.
By supporting strategic sectors, encouraging technology adoption and strengthening domestic supply chains, the PLI Scheme is contributing to deeper localisation, improved integration with global value chains and the long-term strengthening of India’s manufacturing base.
The Production Linked Incentive (PLI) Scheme was launched in 2020 as a strategic reform initiative to strengthen India’s manufacturing base, reduce import dependence, enhance global competitiveness and generate employment. The Scheme incentivises incremental production through performance-linked financial incentives, thereby enabling scale, technology adoption and supply chain integration.
The PLI framework marked a paradigm shift from traditional input-based incentives to outcome-linked support, wherein incentives are directly tied to incremental sales of goods manufactured in India over a defined base year. This approach ensures efficiency, transparency and measurable industrial outcomes, while encouraging firms to expand capacity, deepen domestic value addition and improve productivity.
The combined Index of Eight Core Industries (ICI) increased by 4.0 per cent (provisional) in January, 2026 as compared to the Index in January, 2025. The production of Cement, Steel, Electricity, Fertilizer and Coal recorded positive growth in January, 2026. The details of annual indices, monthly indices and growth rates are provided at Annex I and Annex II.
The ICI measures the combined and individual performance of production of eight core industries viz. Coal, Crude Oil, Natural Gas, Refinery Products, Fertilizers, Steel, Cement and Electricity. The Eight Core Industries comprise 40.27 percent of the weight of items included in the Index of Industrial Production (IIP).
The final growth rate of Index of Eight Core Industries for December 2025 was observed at 4.7 per cent. The cumulative growth rate of ICI during April to January, 2025-26 is 2.8 per cent (provisional) as compared to the corresponding period of last year.
The summary of the Index of Eight Core Industries is given below:
Coal - Coal production (weight: 10.33 per cent) increased by 3.1 per cent in January, 2026 over January, 2025. Its cumulative index declined by 0.3 per cent during April to January, 2025-26 over corresponding period of the previous year.
Crude Oil - Crude Oil production (weight: 8.98 per cent) declined by 5.8 per cent in January, 2026 over January, 2025. Its cumulative index declined by 2.1 per cent during April to January, 2025-26 over corresponding period of the previous year.
Natural Gas - Natural Gas production (weight: 6.88 per cent) declined by 5.0 per cent in January, 2026 over January, 2025. Its cumulative index declined by 3.4 per cent during April to January, 2025-26 over corresponding period of the previous year.
Petroleum Refinery Products - Petroleum Refinery production (weight: 28.04 per cent) in January, 2026 has remained unchanged at 147.2 (provisional) as compared to the index in January, 2025. Its cumulative index increased by 0.1 per cent during April to January, 2025-26 over corresponding period of the previous year.
Fertilizers - Fertilizer production (weight: 2.63 per cent) increased by 3.7 per cent in January, 2026 over January, 2025. Its cumulative index increased by 1.9 per cent during April to January, 2025-26 over corresponding period of the previous year.
Steel - Steel production (weight: 17.92 per cent) increased by 9.9 per cent in January, 2026 over January, 2025. Its cumulative index increased by 9.8 per cent during April to January, 2025-26 over corresponding period of the previous year.
Cement - Cement production (weight: 5.37 per cent) increased by 10.7 per cent in January, 2026 over January, 2025. Its cumulative index increased by 9.1 per cent during April to January, 2025-26 over corresponding period of the previous year.
Electricity - Electricity generation (weight: 19.85 per cent) increased by 3.8 per cent in January, 2026 over January, 2025. Its cumulative index increased by 0.8 per cent during April to January, 2025-26 over corresponding period of the previous year.
Note 1: Data for December, 2025 is Final. Data for January, 2026 is Provisional. Index numbers of Core Industries are revised/finalized as per updated data from source agencies.
Note 2: Since April 2014, Electricity generation data from Renewable sources are also included.
Note 3: The industry-wise weights indicated above are individual industry weights derived from IIP and blown up on pro rata basis to a combined weight of ICI equal to 100.
Note 4: Since March 2019, a new steel product called Hot Rolled Pickled and Oiled (HRPO) under the item ‘Cold Rolled (CR) coils’ within the production of finished steel has also been included.
Note 5: Release of the index for February, 2026 will be on Friday, 20th March, 2026.
Annex I
Performance of Eight Core Industries
Base Year: 2011-12=100
Index
| Sector | Coal | Crude Oil | Natural Gas | Refinery Products | Fertilizers | Steel | Cement | Electricity | Overall Index |
| Weight | 10.33 | 8.98 | 6.88 | 28.04 | 2.63 | 17.92 | 5.37 | 19.85 | 100.00 |
| 2012-13 | 103.2 | 99.4 | 85.6 | 107.2 | 96.7 | 107.9 | 107.5 | 104.0 | 103.8 |
| 2013-14 | 104.2 | 99.2 | 74.5 | 108.6 | 98.1 | 115.8 | 111.5 | 110.3 | 106.5 |
| 2014-15 | 112.6 | 98.4 | 70.5 | 108.8 | 99.4 | 121.7 | 118.1 | 126.6 | 111.7 |
| 2015-16 | 118.0 | 97.0 | 67.2 | 114.1 | 106.4 | 120.2 | 123.5 | 133.8 | 115.1 |
| 2016-17 | 121.8 | 94.5 | 66.5 | 119.7 | 106.6 | 133.1 | 122.0 | 141.6 | 120.5 |
| 2017-18 | 124.9 | 93.7 | 68.4 | 125.2 | 106.6 | 140.5 | 129.7 | 149.2 | 125.7 |
| 2018-19 | 134.1 | 89.8 | 69.0 | 129.1 | 107.0 | 147.7 | 147.0 | 156.9 | 131.2 |
| 2019-20 | 133.6 | 84.5 | 65.1 | 129.4 | 109.8 | 152.6 | 145.7 | 158.4 | 131.6 |
| 2020-21 | 131.1 | 80.1 | 59.8 | 114.9 | 111.6 | 139.4 | 130.0 | 157.6 | 123.2 |
| 2021-22 | 142.3 | 77.9 | 71.3 | 125.1 | 112.4 | 163.0 | 156.9 | 170.1 | 136.1 |
| 2022-23 | 163.5 | 76.6 | 72.4 | 131.2 | 125.1 | 178.1 | 170.6 | 185.2 | 146.7 |
| 2023-24 | 182.7 | 77.1 | 76.8 | 135.9 | 129.8 | 200.4 | 185.7 | 198.3 | 157.8 |
| 2024-25 | 192.0 | 75.4 | 75.9 | 139.7 | 133.5 | 214.1 | 197.4 | 208.6 | 164.9 |
| Apr-Jan 2024-25 | 182.8 | 75.7 | 77.2 | 139.5 | 135.1 | 211.3 | 190.8 | 209.0 | 163.3 |
| Apr-Jan 2025-26* | 182.3 | 74.1 | 74.6 | 139.6 | 137.6 | 232.0 | 208.1 | 210.6 | 167.9 |
*Provisional
Growth Rates (on Y-o-Y basis in per cent)
| Sector | Coal | Crude Oil | Natural Gas | Refinery Products | Fertilizers | Steel | Cement | Electricity | Overall Growth |
| Weight | 10.33 | 8.98 | 6.88 | 28.04 | 2.63 | 17.92 | 5.37 | 19.85 | 100.00 |
| 2012-13 | 3.2 | -0.6 | -14.4 | 7.2 | -3.3 | 7.9 | 7.5 | 4.0 | 3.8 |
| 2013-14 | 1.0 | -0.2 | -12.9 | 1.4 | 1.5 | 7.3 | 3.7 | 6.1 | 2.6 |
| 2014-15 | 8.0 | -0.9 | -5.3 | 0.2 | 1.3 | 5.1 | 5.9 | 14.8 | 4.9 |
| 2015-16 | 4.8 | -1.4 | -4.7 | 4.9 | 7.0 | -1.3 | 4.6 | 5.7 | 3.0 |
| 2016-17 | 3.2 | -2.5 | -1.0 | 4.9 | 0.2 | 10.7 | -1.2 | 5.8 | 4.8 |
| 2017-18 | 2.6 | -0.9 | 2.9 | 4.6 | 0.03 | 5.6 | 6.3 | 5.3 | 4.3 |
| 2018-19 | 7.4 | -4.1 | 0.8 | 3.1 | 0.3 | 5.1 | 13.3 | 5.2 | 4.4 |
| 2019-20 | -0.4 | -5.9 | -5.6 | 0.2 | 2.7 | 3.4 | -0.9 | 0.9 | 0.4 |
| 2020-21 | -1.9 | -5.2 | -8.2 | -11.2 | 1.7 | -8.7 | -10.8 | -0.5 | -6.4 |
| 2021-22 | 8.5 | -2.6 | 19.2 | 8.9 | 0.7 | 16.9 | 20.8 | 8.0 | 10.4 |
| 2022-23 | 14.8 | -1.7 | 1.6 | 4.8 | 11.3 | 9.3 | 8.7 | 8.9 | 7.8 |
| 2023-24 | 11.8 | 0.6 | 6.1 | 3.6 | 3.7 | 12.5 | 8.9 | 7.1 | 7.6 |
| 2024-25 | 5.1 | -2.2 | -1.2 | 2.8 | 2.9 | 6.8 | 6.3 | 5.2 | 4.5 |
| Apr-Jan 2024-25 | 6.0 | -2.1 | 0.5 | 3.3 | 1.7 | 6.6 | 5.1 | 5.1 | 4.5 |
| Apr-Jan 2025-26* | -0.3 | -2.1 | -3.4 | 0.1 | 1.9 | 9.8 | 9.1 | 0.8 | 2.8 |
*Provisional.
Y-o-Y is calculated over the corresponding financial year of previous year
Annex II
Performance of Eight Core Industries
Base Year: 2011-12=100
Index
| Sector | Coal | Crude Oil | Natural Gas | Refinery Products | Fertilizers | Steel | Cement | Electricity | Overall Index |
| Weight | 10.33 | 8.98 | 6.88 | 28.04 | 2.63 | 17.92 | 5.37 | 19.85 | 100.00 |
| Jan-25 | 229.8 | 77.9 | 78.1 | 147.2 | 139.0 | 228.1 | 219.7 | 201.7 | 173.8 |
| Feb-25 | 215.6 | 69.7 | 70.0 | 133.5 | 124.9 | 216.8 | 215.1 | 194.0 | 163.0 |
| Mar-25 | 260.2 | 77.4 | 69.2 | 147.3 | 126.9 | 238.9 | 246.2 | 219.5 | 182.9 |
| Apr-25 | 179.3 | 74.2 | 74.1 | 131.7 | 112.9 | 219.2 | 204.5 | 215.7 | 163.3 |
| May-25 | 189.8 | 76.5 | 75.9 | 143.3 | 127.9 | 225.3 | 209.0 | 218.5 | 170.2 |
| Jun-25 | 173.7 | 73.5 | 73.7 | 138.6 | 132.4 | 223.8 | 214.7 | 220.1 | 167.3 |
| Jul-25 | 143.0 | 75.6 | 75.5 | 141.7 | 141.6 | 239.1 | 194.8 | 228.4 | 168.9 |
| Aug-25 | 153.9 | 77.5 | 75.7 | 138.0 | 143.8 | 234.6 | 186.9 | 221.1 | 166.5 |
| Sep-25 | 150.0 | 71.1 | 72.9 | 129.2 | 137.0 | 231.0 | 187.7 | 213.3 | 160.5 |
| Oct-25 | 170.1 | 73.7 | 75.3 | 141.7 | 147.0 | 225.5 | 196.9 | 193.4 | 162.3 |
| Nov-25 | 203.8 | 71.5 | 73.8 | 137.1 | 143.8 | 227.2 | 202.8 | 181.3 | 162.4 |
| Dec-25 | 222.8 | 73.5 | 74.7 | 147.6 | 145.5 | 244.1 | 240.8 | 204.9 | 177.3 |
| Jan-26* | 236.9 | 73.4 | 74.2 | 147.2 | 144.2 | 250.6 | 243.1 | 209.4 | 180.8 |
*Provisional
Growth Rates (on Y-o-Y basis in per cent)
| Sector | Coal | Crude Oil | Natural Gas | Refinery Products | Fertilizers | Steel | Cement | Electricity | Overall Growth |
| Weight | 10.33 | 8.98 | 6.88 | 28.04 | 2.63 | 17.92 | 5.37 | 19.85 | 100.00 |
| Jan-25 | 4.6 | -1.1 | -1.5 | 8.3 | 3.0 | 4.7 | 14.3 | 2.3 | 5.1 |
| Feb-25 | 1.7 | -5.2 | -6.0 | 0.8 | 10.2 | 6.9 | 10.7 | 3.6 | 3.4 |
| Mar-25 | 1.6 | -1.9 | -12.7 | 0.2 | 8.8 | 8.7 | 12.2 | 7.5 | 4.5 |
| Apr-25 | 3.5 | -2.8 | -0.9 | -4.5 | -4.2 | 4.4 | 6.3 | 1.7 | 1.0 |
| May-25 | 2.8 | -1.8 | -3.6 | 1.1 | -5.9 | 7.4 | 9.7 | -4.7 | 1.2 |
| Jun-25 | -6.8 | -1.2 | -2.8 | 3.4 | -1.2 | 9.7 | 8.2 | -1.2 | 2.2 |
| Jul-25 | -12.3 | -1.3 | -3.2 | -1.1 | 2.0 | 16.6 | 11.6 | 3.7 | 3.7 |
| Aug-25 | 11.4 | 2.4 | -2.2 | 3.0 | 4.6 | 13.6 | 5.4 | 4.1 | 6.5 |
| Sep-25 | -1.2 | -1.3 | -3.8 | -3.7 | 1.6 | 14.4 | 5.0 | 3.1 | 3.3 |
| Oct-25 | -8.5 | -1.2 | -5.0 | 4.6 | 7.4 | 5.9 | 5.2 | -6.9 | -0.1 |
| Nov-25 | 2.1 | -3.2 | -2.5 | -0.9 | 5.6 | 6.7 | 14.6 | -1.5 | 2.1 |
| Dec-25 | 3.6 | -5.6 | -4.4 | -1.0 | 4.1 | 10.1 | 13.7 | 6.3 | 4.7 |
| Jan-26* | 3.1 | -5.8 | -5.0 | 0.0 | 3.7 | 9.9 | 10.7 | 3.8 | 4.0 |
*Provisional.
Y-o-Y is calculated over the corresponding financial year of previous year
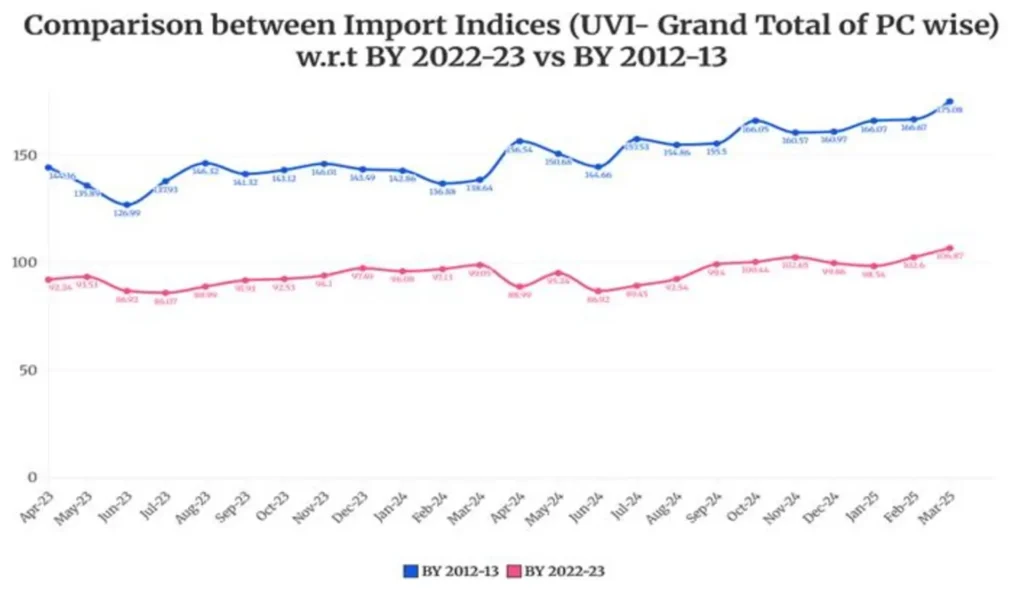
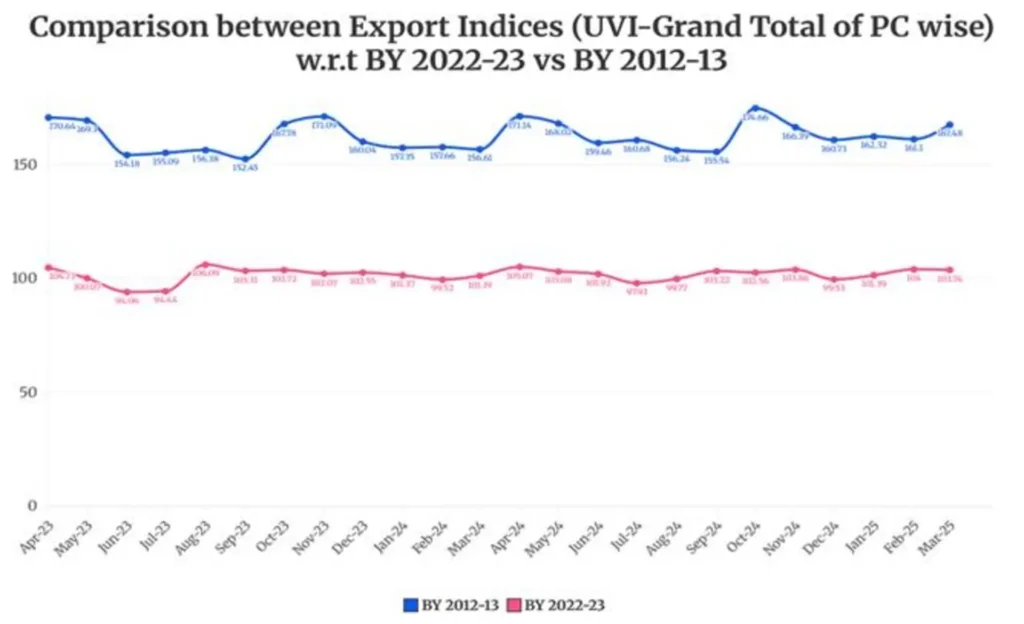
Merchandise Trade Indices are compiled and published by the Directorate General of Commercial Intelligence and Statistics (DGCI&S), Ministry of Commerce & Industry, to measure changes in the unit values (prices) of India’s exports and imports over time. These indices serve as important indicators of external sector price movements and are widely used for economic analysis, including national accounts compilation and assessment of terms of trade. Over the years, the base year of the indices has been periodically revised to reflect structural changes in India’s trade composition and evolving global trade patterns. The most recent revision updates the base year to FY 2022–23 (2022–23 = 100), replacing the earlier base of FY 2012–13, thereby ensuring that the indices accurately represent the current structure of India’s merchandise trade.
Revision of Base Year of India’s Merchandise Trade Indices to FY 2022–23
The Directorate General of Commercial Intelligence and Statistics (DGCI&S), Ministry of Commerce & Industry, has revised the base year of India’s Merchandise Trade Indices from FY 2012–13 to FY 2022–23 (2022–23 = 100), in view of the structural changes in the economy, shifts in commodity composition, evolving trade patterns, and the need for improved alignment with contemporary macroeconomic indicators.
The revision has been undertaken on the recommendations of a committee constituted by DGCI&S under the Chairmanship of Prof. Nachiketa Chattopadhyay, Professor, Indian Statistical Institute, Kolkata. The Committee examined the existing methodology, data coverage, weighting structure, and compilation practices, and recommended suitable refinements in line with international best practices.
Key Features of the Revised Series (Base: FY 2022–23)
Rationale for Revision
Over the past decade, India’s trade basket has undergone substantial changes due to emergence of new commodities, technological advancements, Global supply chain restructuring and changes in relative price structures.
The earlier base year (FY 2012–13) no longer adequately reflected the prevailing trade structure. The revision ensures improved relevance, reliability, and analytical usefulness of the Merchandise Trade Indices for policymakers, researchers, and other stakeholders.
Use of the Revised Series
Merchandise Trade Indices compiled by the Directorate General of Commercial Intelligence and Statistics (DGCI&S) are extensively used by key government institutions for economic analysis and policy formulation. The National Accounts Division (NAD) of the Ministry of Statistics and Programme Implementation uses the Export and Import Unit Value Indices as deflators for estimating real exports and imports in GDP compilation. The Reserve Bank of India (RBI) relies on these indices for external sector assessment, balance of payments analysis, and evaluation of price competitiveness. Various Ministries and Government agencies also use them to frame and review trade-related policies and to assess movements in international prices. In addition, academic institutions, research organizations, and economic analysts utilize Merchandise Trade Indices for empirical research, modelling, and analysis of trade dynamics and terms of trade trendson and economic research.
Availability of Data
The revised Merchandise Trade Indices (Base: FY 2022–23) will be released on the official website of DGCI&S. Detailed methodological documentation is available in the Report of the Committee on Revision of Base Year for Merchandise Trade Indices.
Comparison of the new revised Indices (Base Year: 2022-23) with the already released Indices (Base Year : 2012-13) for 2022-23 and 2023-24 is given below.
#BY means Base Year.
#BY means Base Year.
| Table: Unit Value Index (UVI) and Quantity Index (QI) during FY 2025-26(Apr-Nov) using FY 2022-23 as base year | |||||||||||
| Month | Apr_25 | May_25 | Jun_25 | 1st Qtr 25-26 | Jul_25 | Aug_25 | Sep_25 | 2nd Qtr 25-26 | Oct_25 | Nov_25 | |
| Unit Value Index | Export | 105.31 | 99.73 | 96.31 | 100.33 | 99.31 | 100.55 | 104.08 | 101.23 | 103.78 | 105.32 |
| Import | 92.33 | 97.97 | 91.74 | 94.08 | 96.34 | 100.81 | 108.69 | 101.93 | 110.17 | 106.59 | |
| Quantity Index | Export | 107.85 | 104.76 | 93.88 | 101.91 | 103.41 | 102.64 | 111.04 | 105.57 | 116.19 | 113.06 |
| Import | 138.16 | 126.61 | 112.58 | 125.17 | 122.47 | 124.06 | 126.45 | 124.32 | 137.04 | 121.75 | |
* Qtr means Quarter.
Meaning and interpretation of the Indices
The Unit Value Indices and the Quantity Indices may be interpreted along the following lines.
The Unit Value Index answers the question: What is the growth in the average Unit Value of the items1 traded in the current month with respect to the same month in the Base Year?
So, an Unit Value Index of, say, 120 means that if the items that have been traded in the current month had been traded in the same month of the base year, and if the average price (or unit value) of those items had been Rs.100 in that month of the base year, then the average price (or unit value) of these items in the current month is Rs.120. Or that, there is a 20% increase in the average Unit Value, with respect to the Base Year, of the items that have been traded in the Current Month.
For example, let us suppose 30 items, 10 items each from 3 different Principal Commodities, have been traded in the current month. If these 30 items had been traded in the corresponding month of the base year at an average price of Rs.100, then the average price of these items in the current year is Rs.120.
It is to be noted that there are two successive steps of averaging done here. The first averaging is done over all the items (or ITCHS) of a PC group to arrive at the Index of that PC group. And the second averaging is done over all the PC groups to arrive at the Index at the Grand Total level for all commodities (which is the overall Index for India for a month). In both the stages, a weighted average is taken where the weights are proportional to the importance of the items and the PC groups respectively, and the Laspeyres Formula is used for averaging.
Quantity Indices, say, 200 means that if in the base year on an average 100 units were traded in India in the base year, then in the current year on an average 200 units were traded. However, it must be remembered that averaging quantities are different from averaging prices, since quantities in different units cannot be added directly.
So, the Quantity Indices are calculated by dividing the Value Indices by the Unit Value Indices. For example, if there is an increase in the Value of Export from Rs. 10,000 to Rs. 24,000, then the Value Index is 24000/10000 × 100 = 240. If the Unit Value Index is 120, then the Quantity Index comes to 240/120 × 100 = 200. So, loosely it can be said that, if the value of export has increased 2.4 times and the price of the commodities has increased 1.2 times, then the quantity must have doubled.
However, it may be noted that a very high or low Quantity Index may indicate the presence of Base Effect.
The Interpretation of the Bilateral and Regional Indices can be seen as an extension of the above.
A Unit Value Index of 120 with respect to a country, say Bangladesh, means that if all the items that have been traded with Bangladesh in the current month had been traded in the same month of the base year with the same country, and if the average price (or unit value) of those items had been Rs.100 in that month of the base year, then the average price (or unit value) of these items in the current month is Rs.120.
Similarly, a Quantity Index of 200 with respect to a country, say Bangladesh, means that if in the base year on an average 100 units were traded in India in the base year, then in the current year on an average 200 units were traded.
Comparability of the Indices across time
It is to be noted that the weights in the Index Number formula are fixed across time and there are twelve sets of weights for the twelve months. Hence, comparability of Indices is meaningful only when Indices of same month are compared across years. Different months may attach different weights to the same item, and hence comparing indices of two different months becomes vague and may have little applicability.
Further, the weights of the items that are not present in the trade basket of the current month are distributed to all the items that have been traded in the current month. This distribution is done in proportion to the weights of those items.
For example, let us suppose there are only 3 commodities for trade, say A, B and C. In month May of the Base year, let us suppose that the trade value of A was Rs. 50, B was Rs. 100 and C was Rs. 50. Then the weights assigned to A, B and C in the month of May of the following years would be in the ratio 50 :100 :50. However, in case, C is not traded in the current month, then the weight of C would be distributed proportionately among A and B, again in the ratio 1:2 (since in May the weights of A and B are in the ratio of 50 : 100, i.e., 1 : 2). So, in the current month the weights of A and B would be 3313 and 6623 .
As a result, the weights in any two given months are dependent on exactly the number of items (ITCHS codes) traded in those months. If the items traded are widely different, inference drawn from the comparison of the Indices may be done accordingly. On the other hand, more the similarity in the number of items traded more is the comparability of the two indices.
Net Terms of Trade:
Net Terms of Trade also called commodityTerms of Trade is defined as a ratio of export prices to import prices.
Let say 2022-23 be the base year and 2023-24 be the final year. We express both export and import prices in 2022-23 as 100. Now, suppose that at the end of 2023-24, it is found that the index of export prices decreased to 90 and index of import prices roses to 150. Then the Net Terms of Trade has changed to 90100150100=35 . Then terms of trade as index=35*100=60 . It implies that terms of trade of the country have decreased by about 40% in 2023-24 as compared with 2022-23. It thus shows a deterioration or a worsening of the terms of trade of the country.
If the index of export prices has risen to 150 and that of import prices had risen to 120, then the net terms of trade would have changed to 150120*100=125 . This implies an improvement in the net terms of trade of the country by 25% in 2023-24 over 2022-23.
Gross Terms of Trade:
Gross Terms of Trade is the ratio of physicalquantity of import to physical quantity of export.
Let say 2022-23 be the base year. In that year, the quantities export and import are denoted by 100. Now, suppose that in the year 2023-24, the index of quantity of import was 150 and that of quantity of export was 120. Then the gross terms of trade is given by 150100120100=54, in terms of percentage =54*100=125 . This implies that there was an improvement of gross terms of trade by 25% in 2023-24 compared to 2022-23.
Income Terms of Trade: Income Terms of Trade is defined as- Net Terms of Trademultiplied by quantity of export.
Union Minister for Health and Family Welfare Shri J.P. Nadda will launch the Tetanus and Adult Diphtheria (Td) vaccine on 21st February 2026 (Tomorrow) at the Central Research Institute (CRI), Kasauli, Himachal Pradesh.
Extensive scientific evidence indicates that widespread childhood immunization with DPT group of vaccines has significantly reduced the incidence of diphtheria and tetanus in many countries. However, antibody levels may decline over time especially in the case of Diphtheria, necessitating booster doses. In view of this in 2006, the World Health Organization (WHO) recommended that countries transition from Tetanus Toxoid (TT) vaccine to Td vaccine. This recommendation was reaffirmed in the WHO Tetanus Vaccine Position Paper (2017) and through deliberations of the Strategic Advisory Group of Experts (SAGE) in 2002 and 2016.
The National Technical Advisory Group on Immunization (NTAGI), Ministry of Health & Family Welfare, has also recommended replacing the TT vaccine with the Td vaccine in India’s immunization programme for all age groups, including pregnant women. This transition aims to extend and strengthen protection against diphtheria in addition to tetanus, while sustaining the gains achieved in maternal and neonatal tetanus elimination and routine immunization activities. To support this initiative, CRI has undertaken the manufacturing of the Td vaccine. The Institute successfully completed developmental studies, obtained a Test License, secured waivers for preclinical studies and Phase I, II, and III clinical trials, received Marketing Authorization and License for manufacture and sale, initiated commercial manufacturing, and obtained release from the Central Drugs Laboratory, Kasauli. The vaccine is now ready for launch and supply under the Universal Immunization Programme (UIP).
Following the launch of the Td vaccine by the Hon’ble Union Minister of Health & Family Welfare and Minister of Chemicals & Fertilizers, CRI will supply 55 lakh doses to the UIP by April 2026. The supply is expected to increase progressively in subsequent years to further strengthen the Universal Immunization Programme of Govt. of India.
Tetanus (T) is a serious disease that causes painful muscle stiffness and spasms and can lead to severe health complications, including inability to open the mouth (lockjaw), difficulty in swallowing and breathing, and may result in death. Diphtheria (D) is a potentially life-threatening infection that can cause breathing difficulties, heart failure, paralysis, and death.
The Td vaccine (Tetanus and adult Diphtheria Vaccine – Adsorbed, Reduced D-Antigen Content) provides protection against both tetanus and diphtheria. It is prepared by combining purified diphtheria toxoid and purified tetanus toxoid. The antigens are adsorbed onto aluminum phosphate, which acts as an adjuvant, and thiomersal is added as a preservative. The introduction of the Td vaccine is aimed at strengthening protection among adolescents and adults and reducing morbidity and mortality associated with these vaccine-preventable diseases.
The Central Research Institute (CRI), functioning under the Directorate General of Health Services, Ministry of Health and Family Welfare, Government of India since 1905, plays a pivotal role in vaccine production in alignment with the National Vaccine Policy. The Institute is engaged in the manufacture and supply of vaccines and antisera to meet the requirements of the Universal Immunization Programme (UIP) and other public health initiatives. The launch of the Td vaccine at CRI is expected to augment domestic manufacturing capacity and ensure sustained availability of quality-assured vaccines under the National Immunization Programme.
Senior officials from the Ministry of Health and Family Welfare, representatives of State Health Departments, public health experts, and other stakeholders will be present on the occasion. The programme will include an address by the Union Health Minister Shri J.P. Nadda.