Union Minister of Commerce and Industry, Shri Piyush Goyal, will visit the United Arab Emirates (UAE) from 18–19 September 2025 to co-chair the 13th India-UAE High Level Task Force on Investments (HLJTFI) along with His Highness Sheikh Hamed bin Zayed Al Nahyan, Managing Director of the Abu Dhabi Investment Authority (ADIA).
The meeting will review progress on the India-UAE Comprehensive Economic Partnership Agreement (CEPA), the Double Taxation Treaty, and UAE-India Central Bank matters. Both sides will also explore opportunities for investment in key sectors, including maritime and space, that hold strong potential for growth.
During the visit, Shri Goyal will co-chair the UAE-India Business Council (UIBC) roundtable with His Excellency Dr. Thani bin Ahmed Al Zeyoudi, UAE Minister of Foreign Trade, and interact with CEOs of leading Indian and UAE companies. He will also hold bilateral meetings focused on strengthening trade, investment, and cooperation across priority sectors.
The Union Minister is expected to meet H.H. Sheikh Tahnoun bin Zayed Al Nahyan, National Security Advisor of the UAE and Chairman of the International Holding Company (IHC); His Excellency Ahmed Jasim Al Zaabi, Chairman of the Abu Dhabi Department of Economic Development (ADDED); and Mr. Syed Basar Shueb, Managing Director of IHC, along with other key private sector stakeholders.
The 12th HLJTFI, held in Mumbai in October 2024, saw the ratification of the India-UAE Bilateral Investment Treaty signed during Prime Minister Shri Narendra Modi’s visit to the UAE in February 2024. Established in 2013, the HLJTFI has served as a vital platform for promoting trade and investment ties, identifying new opportunities, and resolving investor issues.
UAE remains one of India’s most important strategic partners. Their Comprehensive Strategic Partnership is underpinned by deep political engagement, robust economic integration, and collaboration across energy, defence, technology, and food security. The CEPA, which came into force in May 2022, has nearly doubled bilateral merchandise trade from USD 43.3 billion in FY 2020-21 to USD 83.7 billion in FY 2023-24, while catalyzing a structural shift towards non-oil sectors.
The annual rate of inflation based on All India Wholesale Price Index (WPI) number is 0.52% (provisional) for the month of August, 2025 (over August, 2024). Positive rate of inflation in August, 2025 is primarily due to increase in prices of food products, other manufacturing, non-food articles, other non-metallic mineral products and other transport equipment etc. The index numbers and inflation rate for the last three months of all commodities and WPI components are given below:
| Index Numbers and Annual Rate of Inflation (Y-o-Y in %) * | |||||||
| All Commodities/Major Groups | Weight (%) | Jun-25(F) | Jul-25(P) | Aug-25(P) | |||
| Index | Inflation | Index | Inflation | Index | Inflation | ||
| All Commodities | 100.00 | 153.7 | -0.19 | 154.4 | -0.58 | 155.2 | 0.52 |
| I. Primary Articles | 22.62 | 186.1 | -3.22 | 188.0 | -4.95 | 191.0 | -2.10 |
| II. Fuel & Power | 13.15 | 142.3 | -3.13 | 144.6 | -2.43 | 143.6 | -3.17 |
| III. Manufactured Products | 64.23 | 144.7 | 1.90 | 144.6 | 2.05 | 144.9 | 2.55 |
| Food Index | 24.38 | 190.2 | -0.26 | 191.3 | -2.15 | 193.5 | 0.21 |
Note: F: Final, P: Provisional, *Annual rate of WPI inflation calculated over the corresponding month of previous year
2. The month over month change in WPI for the month of August, 2025 stood at 0.52% as compared to July, 2025. The monthly change in WPI for last six-month is summarized below:
| Month Over Month (M-o-M in %) change in WPI Index# | |||||||
| All Commodities/Major Groups | Weight | Mar-25 | Apr-25 | May-25 | Jun-25(F) | Jul-25(P) | Aug-25(P) |
| All Commodities | 100.00 | -0.06 | -0.39 | -0.32 | 0.00 | 0.46 | 0.52 |
| I. Primary Articles | 22.62 | -0.70 | -0.05 | -0.32 | 0.70 | 1.02 | 1.60 |
| II. Fuel & Power | 13.15 | -0.85 | -4.21 | -1.92 | -0.42 | 1.62 | -0.69 |
| III. Manufactured Products | 64.23 | 0.42 | 0.21 | 0.07 | -0.21 | -0.07 | 0.21 |
| Food Index | 24.38 | -0.05 | 0.74 | -0.42 | 0.16 | 0.58 | 1.15 |
Note: F: Final, P: Provisional, #Monthly rate of change, based on month over month (M-o-M) WPI calculated over the preceding month
3. Month-over-Month Change in Major Groups of WPI:
4. WPI Food Index (Weight 24.38%): The Food Index consisting of 'Food Articles' from Primary Articles group and 'Food Product' from Manufactured Products group have increased from 191.3 in July, 2025 to 193.5 in August, 2025. The rate of inflation (Y-o-Y) based on WPI Food Index remain positive from (-) 2.15% in July, 2025 to 0.21% in August, 2025.
5. Final Index for the month of June, 2025 (Base Year: 2011-12=100): For the month of June, 2025, the final Wholesale Price Index and inflation rate for 'All Commodities' (Base: 2011-12=100) stood at 153.7 and (-) 0.19% respectively.
The details of all India Wholesale Price Indices and Rates of Inflation for different commodity groups based on updated figures are at Annex I. The Annual rate of Inflation (Y-o-Y) based on WPI for different commodity groups in the last six months is at Annex II. WPI for different commodity groups in the last six months is at Annex III.
6. Response Rate: The WPI for August, 2025 has been compiled at a weighted response rate of 82.1 per cent, while the final figure for June, 2025 is based on the weighted response rate of 95.2 per cent. The provisional figures of WPI will undergo revision as per the revision policy of WPI. This press release, item indices, and inflation numbers are available at our website https://eaindustry.nic.in.
7. Next date of Press Release: WPI for the month of September, 2025 would be released on 14/10/2025.
Note: DPIIT releases index number of wholesale price in India on monthly basis on 14th of every month (or next working day, if 14th falls on holiday) with a time lag of two weeks of the reference month, and the index number is compiled with data received from institutional sources and selected manufacturing units across the country. This press release contains WPI (Base Year 2011-12=100) for the month of August, 2025 (Provisional), June, 2025 (Final) and other months/years. Provisional figures of WPI are finalised after 10 weeks (from the month of reference), and frozen thereafter.
Annex-I
All India Wholesale Price Indices and Rates of Inflation (Base Year: 2011-12=100) for August, 2025
| Commodities/Major Groups/Groups/Sub-Groups/Items | Weight | IndexAugust-25* | Latest month over Month (MoM) | Inflation (YoY) | Rate of Inflation (YoY) | |||
| Jul-Aug 2024 | Jul-Aug2025* | 2024-25 (Apr-Aug) | 2025-26 (Apr-Aug) | August 2024 | August2025* | |||
| ALL COMMODITIES | 100.00 | 155.2 | -0.58 | 0.52 | 2.14 | 0.14 | 1.25 | 0.52 |
| I. PRIMARY ARTICLES | 22.62 | 191.0 | -1.37 | 1.60 | 5.42 | -2.61 | 2.52 | -2.10 |
| A. Food Articles | 15.26 | 202.6 | -1.92 | 1.45 | 6.97 | -2.85 | 3.06 | -3.06 |
| Cereals | 2.82 | 206.7 | 0.79 | 0.39 | 8.91 | 2.05 | 8.66 | 1.03 |
| Paddy | 1.43 | 200.3 | 0.45 | -0.50 | 11.20 | 0.49 | 9.60 | -0.84 |
| Wheat | 1.03 | 211.8 | 1.00 | 1.34 | 6.52 | 5.21 | 7.38 | 4.75 |
| Pulses | 0.64 | 199.0 | 1.26 | 1.58 | 19.77 | -12.11 | 18.27 | -14.85 |
| Vegetables | 1.87 | 260.3 | -12.59 | 5.60 | 8.97 | -21.28 | -9.95 | -14.18 |
| Potato | 0.28 | 220.0 | -1.03 | -5.82 | 72.71 | -35.20 | 77.78 | -44.11 |
| Onion | 0.16 | 193.8 | 12.45 | 0.16 | 74.12 | -33.19 | 67.25 | -50.46 |
| Fruits | 1.60 | 197.6 | 5.86 | 3.46 | 9.18 | 4.43 | 16.75 | -4.86 |
| Milk | 4.44 | 190.7 | -0.05 | 0.32 | 4.15 | 2.34 | 3.51 | 2.58 |
| Eggs, Meat & Fish | 2.40 | 173.2 | -0.35 | 0.81 | -0.78 | -0.53 | -0.75 | 0.06 |
| B. Non-Food Articles | 4.12 | 169.1 | 0.82 | 2.92 | -2.68 | 2.80 | -1.84 | 5.56 |
| Oil Seeds | 1.12 | 203.5 | -0.89 | 2.88 | -4.76 | 6.84 | -4.90 | 13.94 |
| C. Minerals | 0.83 | 235.1 | 0.44 | 2.66 | 6.29 | 1.27 | 10.75 | 3.30 |
| D. Crude Petroleum & Natural gas | 2.41 | 139.7 | -1.84 | -0.43 | 7.50 | -11.81 | 1.77 | -9.87 |
| Crude Petroleum | 1.95 | 113.6 | -3.66 | -2.32 | 7.73 | -15.00 | -0.98 | -13.68 |
| II. FUEL & POWER | 13.15 | 143.6 | 0.07 | -0.69 | 0.39 | -3.46 | -0.54 | -3.17 |
| LPG | 0.64 | 113.0 | 0.53 | -1.91 | 2.25 | 0.50 | 14.40 | -1.22 |
| Petrol | 1.60 | 145.1 | -0.71 | -0.68 | -1.28 | -7.05 | -4.23 | -5.72 |
| HSD | 3.10 | 160.8 | -0.42 | 0.37 | -1.88 | -4.84 | -3.03 | -3.54 |
| III.MANUFACTURED PRODUCTS | 64.23 | 144.9 | -0.28 | 0.21 | 0.98 | 2.25 | 1.00 | 2.55 |
| Mf/o Food Products | 9.12 | 178.4 | 0.24 | 0.62 | 3.52 | 7.73 | 3.54 | 7.15 |
| Vegetable & Animal Oils and Fats | 2.64 | 185.0 | 0.80 | 1.54 | -0.23 | 24.25 | 2.03 | 22.92 |
| Mf/o Beverages | 0.91 | 135.6 | 0.37 | 0.30 | 1.93 | 1.51 | 1.98 | 1.19 |
| Mf/o Tobacco Products | 0.51 | 179.9 | -0.40 | 0.00 | 2.18 | 2.66 | 1.97 | 2.22 |
| Mf/o Textiles | 4.88 | 137.8 | -0.66 | 0.88 | 0.68 | 0.51 | 1.34 | 1.40 |
| Mf/o Wearing Apparel | 0.81 | 155.9 | 0.46 | -0.06 | 1.67 | 1.88 | 1.53 | 1.96 |
| Mf/o Leather and Related Products | 0.54 | 127.9 | 0.40 | 0.24 | -0.21 | 2.78 | -0.48 | 2.40 |
| Mf/o Wood and Products of Wood and Cork | 0.77 | 150.0 | 0.07 | -0.07 | 3.30 | 0.54 | 3.17 | 0.33 |
| Mf/o Paper and Paper Products | 1.11 | 139.8 | 0.94 | 0.00 | -3.16 | 1.10 | 0.58 | 0.00 |
| Mf/o Chemicals and Chemical Products | 6.47 | 137.1 | 0.00 | 0.07 | -1.48 | 0.69 | 0.29 | 0.29 |
| Mf/o Pharmaceuticals, Medicinal Chemical and Botanical Products | 1.99 | 146.0 | 0.07 | 0.00 | 1.16 | 1.12 | 2.12 | 0.83 |
| Mf/o Rubber and Plastics Products | 2.30 | 129.5 | 0.00 | 0.31 | 0.97 | 0.67 | 1.57 | 0.31 |
| Mf/o other Non-Metallic Mineral Products | 3.20 | 133.7 | -0.15 | 0.15 | -2.79 | 1.66 | -3.85 | 3.00 |
| Cement, Lime and Plaster | 1.64 | 133.1 | -0.78 | 0.00 | -5.05 | 1.44 | -7.13 | 4.23 |
| Mf/o Basic Metals | 9.65 | 137.4 | -1.78 | -0.07 | -0.35 | -2.07 | -1.64 | -0.65 |
| Mild Steel - Semi Finished Steel | 1.27 | 115.9 | -3.62 | -0.26 | -2.41 | -1.44 | -5.22 | 1.31 |
| Mf/o Fabricated Metal Products, Except Machinery and Equipment | 3.15 | 136.9 | 0.22 | 0.22 | -2.06 | 0.53 | -1.66 | 0.22 |
Note: * = Provisional. Mf/o = Manufacture of
Annex-II
WPI Inflation (Base Year: 2011-12=100) for last 6 months
| Commodities/Major Groups/Groups/Sub-Groups/Items | Weight | WPI based inflation (YoY) figures for last 6 months | |||||
| Mar-25 | Apr-25 | May-25 | Jun-25 | Jul-25* | Aug-25* | ||
| ALL COMMODITIES | 100.00 | 2.25 | 0.85 | 0.13 | -0.19 | -0.58 | 0.52 |
| I. PRIMARY ARTICLES | 22.62 | 1.26 | -0.91 | -1.75 | -3.22 | -4.95 | -2.10 |
| A. Food Articles | 15.26 | 1.78 | 0.30 | -1.25 | -3.65 | -6.29 | -3.06 |
| Cereals | 2.82 | 5.44 | 3.86 | 2.56 | 1.44 | 1.43 | 1.03 |
| Paddy | 1.43 | 3.67 | 2.03 | 0.96 | 0.25 | 0.10 | -0.84 |
| Wheat | 1.03 | 8.20 | 7.41 | 5.75 | 3.77 | 4.40 | 4.75 |
| Pulses | 0.64 | -3.03 | -5.57 | -10.41 | -14.09 | -15.12 | -14.85 |
| Vegetables | 1.87 | -14.98 | -17.16 | -21.40 | -22.65 | -28.96 | -14.18 |
| Potato | 0.28 | -6.77 | -23.93 | -28.97 | -32.50 | -41.26 | -44.11 |
| Onion | 0.16 | 26.15 | 0.20 | -14.17 | -33.45 | -44.38 | -50.46 |
| Fruits | 1.60 | 20.78 | 17.06 | 11.01 | 1.69 | -2.65 | -4.86 |
| Milk | 4.44 | 1.63 | 1.08 | 3.32 | 2.53 | 2.20 | 2.58 |
| Eggs, Meat & Fish | 2.40 | 0.89 | -0.29 | -1.01 | -0.29 | -1.09 | 0.06 |
| B. Non-Food Articles | 4.12 | 1.62 | 1.52 | 1.28 | 2.16 | 3.40 | 5.56 |
| Oil Seeds | 1.12 | 0.34 | 1.95 | 2.68 | 5.89 | 9.77 | 13.94 |
| C. Minerals | 0.83 | 10.79 | 1.79 | 0.57 | -0.35 | 1.06 | 3.30 |
| D. Crude Petroleum & Natural gas | 2.41 | -7.64 | -15.55 | -11.54 | -10.77 | -11.15 | -9.87 |
| Crude Petroleum | 1.95 | -11.50 | -19.85 | -13.97 | -12.31 | -14.86 | -13.68 |
| II. FUEL & POWER | 13.15 | 0.00 | -3.76 | -4.80 | -3.13 | -2.43 | -3.17 |
| LPG | 0.64 | 0.24 | -0.41 | 0.25 | 2.68 | 1.23 | -1.22 |
| Petrol | 1.60 | -3.86 | -7.70 | -9.44 | -6.57 | -5.74 | -5.72 |
| HSD | 3.10 | -2.88 | -5.04 | -6.20 | -5.12 | -4.30 | -3.54 |
| III. MANUFACTURED PRODUCTS | 64.23 | 3.21 | 2.62 | 2.11 | 1.90 | 2.05 | 2.55 |
| Mf/o Food Products | 9.12 | 11.10 | 9.45 | 8.45 | 6.87 | 6.74 | 7.15 |
| Vegetable & Animal Oils and Fats | 2.64 | 31.37 | 28.21 | 25.81 | 22.30 | 22.04 | 22.92 |
| Mf/o Beverages | 0.91 | 1.74 | 1.96 | 1.65 | 1.50 | 1.27 | 1.19 |
| Mf/o Tobacco Products | 0.51 | 3.18 | 2.95 | 4.30 | 2.04 | 1.81 | 2.22 |
| Mf/o Textiles | 4.88 | 1.64 | 0.88 | 0.44 | 0.00 | -0.15 | 1.40 |
| Mf/o Wearing Apparel | 0.81 | 1.98 | 0.72 | 2.11 | 2.10 | 2.50 | 1.96 |
| Mf/o Leather and Related Products | 0.54 | 1.37 | 3.72 | 2.90 | 2.33 | 2.57 | 2.40 |
| Mf/o Wood and Products of Wood and Cork | 0.77 | 0.60 | 0.80 | 0.47 | 0.60 | 0.47 | 0.33 |
| Mf/o Paper and Paper Products | 1.11 | 2.17 | 1.96 | 1.45 | 1.16 | 0.94 | 0.00 |
| Mf/o Chemicals and Chemical Products | 6.47 | 0.96 | 1.40 | 1.03 | 0.51 | 0.22 | 0.29 |
| Mf/o Pharmaceuticals, Medicinal Chemical and Botanical Products | 1.99 | 0.98 | 1.39 | 1.32 | 1.18 | 0.90 | 0.83 |
| Mf/o Rubber and Plastics Products | 2.30 | 1.33 | 1.72 | 0.78 | 0.54 | 0.00 | 0.31 |
| Mf/o other Non-Metallic Mineral Products | 3.20 | -0.53 | -0.38 | 0.98 | 2.07 | 2.69 | 3.00 |
| Cement, Lime and Plaster | 1.64 | -2.46 | -2.32 | 0.15 | 1.92 | 3.42 | 4.23 |
| Mf/o Basic Metals | 9.65 | 0.58 | -0.92 | -3.11 | -3.28 | -2.34 | -0.65 |
| Mild Steel - Semi Finished Steel | 1.27 | 1.11 | 0.42 | -2.87 | -3.78 | -2.11 | 1.31 |
| Mf/o Fabricated Metal Products, Except Machinery and Equipment | 3.15 | 0.15 | 0.59 | 0.95 | 0.66 | 0.22 | 0.22 |
Note: * = Provisional. Mf/o = Manufacture of
Annex-III
Wholesale Price Indices (Base Year: 2011-12=100) for last 6 months
| Commodities/Major Groups/Groups/Sub-Groups/Items | Weight | WPI Numbers for last 6 months | |||||
| Mar-25 | Apr-25 | May-25 | Jun-25 | Jul-25* | Aug-25* | ||
| ALL COMMODITIES | 100.00 | 154.8 | 154.2 | 153.7 | 153.7 | 154.4 | 155.2 |
| I. PRIMARY ARTICLES | 22.62 | 185.5 | 185.4 | 184.8 | 186.1 | 188.0 | 191.0 |
| A. Food Articles | 15.26 | 194.8 | 197.4 | 196.8 | 198.0 | 199.7 | 202.6 |
| Cereals | 2.82 | 211.1 | 207.2 | 204.7 | 204.4 | 205.9 | 206.7 |
| Paddy | 1.43 | 203.2 | 201.4 | 199.6 | 199.9 | 201.3 | 200.3 |
| Wheat | 1.03 | 217.6 | 211.6 | 207.8 | 206.5 | 209.0 | 211.8 |
| Pulses | 0.64 | 205.0 | 203.6 | 200.6 | 197.0 | 195.9 | 199.0 |
| Vegetables | 1.87 | 179.4 | 188.3 | 185.8 | 219.2 | 246.5 | 260.3 |
| Potato | 0.28 | 199.7 | 205.4 | 221.4 | 232.0 | 233.6 | 220.0 |
| Onion | 0.16 | 272.6 | 204.5 | 176.3 | 185.8 | 193.5 | 193.8 |
| Fruits | 1.60 | 218.5 | 234.7 | 224.8 | 204.3 | 191.0 | 197.6 |
| Milk | 4.44 | 187.2 | 187.3 | 190.1 | 190.2 | 190.1 | 190.7 |
| Eggs, Meat & Fish | 2.40 | 170.4 | 172.1 | 176.6 | 174.0 | 171.8 | 173.2 |
| B. Non-Food Articles | 4.12 | 162.6 | 160.1 | 158.5 | 160.7 | 164.3 | 169.1 |
| Oil Seeds | 1.12 | 179.3 | 183.0 | 184.0 | 190.6 | 197.8 | 203.5 |
| C. Minerals | 0.83 | 245.5 | 228.0 | 228.4 | 228.8 | 229.0 | 235.1 |
| D. Crude Petroleum & Natural gas | 2.41 | 145.1 | 137.4 | 138.8 | 139.2 | 140.3 | 139.7 |
| Crude Petroleum | 1.95 | 120.8 | 113.9 | 113.9 | 116.8 | 116.3 | 113.6 |
| II. FUEL & POWER | 13.15 | 152.1 | 145.7 | 142.9 | 142.3 | 144.6 | 143.6 |
| LPG | 0.64 | 123.7 | 120.9 | 120.3 | 118.8 | 115.2 | 113.0 |
| Petrol | 1.60 | 151.8 | 146.3 | 142.9 | 143.7 | 146.1 | 145.1 |
| HSD | 3.10 | 165.4 | 160.0 | 157.3 | 157.5 | 160.2 | 160.8 |
| III.MANUFACTURED PRODUCTS | 64.23 | 144.6 | 144.9 | 145.0 | 144.7 | 144.6 | 144.9 |
| Mf/o Food Products | 9.12 | 180.1 | 179.5 | 178.4 | 177.3 | 177.3 | 178.4 |
| Vegetable & Animal Oils and Fats | 2.64 | 191.4 | 189.5 | 185.7 | 181.5 | 182.2 | 185.0 |
| Mf/o Beverages | 0.91 | 134.8 | 135.5 | 135.4 | 135.4 | 135.2 | 135.6 |
| Mf/o Tobacco Products | 0.51 | 181.9 | 181.5 | 181.8 | 179.8 | 179.9 | 179.9 |
| Mf/o Textiles | 4.88 | 136.5 | 136.9 | 136.3 | 136.4 | 136.6 | 137.8 |
| Mf/o Wearing Apparel | 0.81 | 154.5 | 154.2 | 155.2 | 155.5 | 156.0 | 155.9 |
| Mf/o Leather and Related Products | 0.54 | 125.4 | 128.2 | 127.6 | 127.5 | 127.6 | 127.9 |
| Mf/o Wood and Products of Wood and Cork | 0.77 | 150.0 | 150.6 | 150.2 | 150.4 | 150.1 | 150.0 |
| Mf/o Paper and Paper Products | 1.11 | 141.0 | 140.6 | 140.1 | 140.0 | 139.8 | 139.8 |
| Mf/o Chemicals and Chemical Products | 6.47 | 136.9 | 137.6 | 137.2 | 137.1 | 137.0 | 137.1 |
| Mf/o Pharmaceuticals, Medicinal Chemical and Botanical Products | 1.99 | 144.8 | 145.5 | 145.9 | 145.7 | 146.0 | 146.0 |
| Mf/o Rubber and Plastics Products | 2.30 | 129.9 | 130.3 | 129.3 | 129.5 | 129.1 | 129.5 |
| Mf/o other Non-Metallic Mineral Products | 3.20 | 132.4 | 132.1 | 133.6 | 133.4 | 133.5 | 133.7 |
| Cement, Lime and Plaster | 1.64 | 131.0 | 130.5 | 133.0 | 132.8 | 133.1 | 133.1 |
| Mf/o Basic Metals | 9.65 | 139.5 | 140.1 | 140.2 | 138.6 | 137.5 | 137.4 |
| Mild Steel - Semi Finished Steel | 1.27 | 118.3 | 118.9 | 118.5 | 117.1 | 116.2 | 115.9 |
| Mf/o Fabricated Metal Products, Except Machinery and Equipment | 3.15 | 136.4 | 136.8 | 137.7 | 137.0 | 136.6 | 136.9 |
Note: * = Provisional. Mf/o = Manufacture of
Sustainability is non-negotiable in India’s growth journey, Union Minister of Commerce and Industry Shri Piyush Goyal said while addressing the inauguration of the IEC (International Electrotechnical Commission) General Meeting Exhibition organized by the Bureau of Indian Standards (BIS) today. Shri Goyal said that India is very focused on sustainability as the pillar of growth because every Indian intrinsically believes in respecting nature, being born into a culture and tradition where harmony with the environment is a way of life.
He said that India believes in learning from the developed world, particularly from the high-quality standards that have helped economies across the globe to grow and prosper. He emphasized that such high standards are central to India’s own growth as the world’s fastest-growing large economy.
The Minister highlighted that initiatives such as the International Electrotechnical Commission General Meeting provide a valuable platform for the exchange of ideas, systems, and methods to decide on standards. When countries come together to develop such standards, they not only help harmonize practices and bring them to a high minimum level, but also create opportunities for stronger economic cooperation. The Minister underlined that good standards are the need of the hour for a developing country like India, as they provide the foundation for growth both at the national level and for contributing to international progress.
Shri Goyal noted that harmonizing global standards not only enhances product quality but also facilitates free trade, opens markets, and promotes wider international collaboration. He said that such initiatives will help expand open markets, encourage free and fair trade, and provide a level playing field for businesses. Referring to the participation of international experts at the IEC General Meeting, he expressed confidence that they would delve into new ideas and explore ways forward to promote the adoption of standards. He added that with many experts coming from engineering backgrounds, the deliberations at the exhibition would enrich the global conversation on standards. He reiterated that the promotion of high-quality standards is essential for ensuring consumer welfare, driving demand, and sustaining long-term growth.
The Minister highlighted India’s strong commitment to meeting its nationally determined contributions under the Paris Agreement, and further improvements made through different COP announcements. He stressed that India does this not because of external force or pressure, but as a responsible global citizen, out of belief in sustainability itself. He added that India is deeply committed to the principles of a circular economy, reducing waste, and conserving resources, and sees these principles as central to its long-term development journey.
Shri Goyal stated that standards play a critical role in building India’s future. He pointed out that India has thousands of technical bodies and committees that work on setting standards across different sectors. In the early years, the focus was more on creating standards and allowing their voluntary implementation. Over time, however, experience taught that stricter adherence to standards was necessary, leading to the introduction of Quality Control Orders in critical areas. He cited the example of QCOs for toys, which have had a transformative effect by putting an end to substandard products in the market, encouraging the manufacturing of high-quality toys in India, and ensuring the safety of children.
The Minister stressed that quality does not increase costs. On the contrary, he said, quality reduces costs by cutting wastage, improving efficiency in operations, and delivering safer and better products to consumers. He explained that quality standards ensure that people get reliable goods and services of high value for their everyday lives. He emphasized that standards must be seen as a strategic lever for consumer satisfaction, consumer safety, enhancing competitiveness, and ultimately also for meeting climate challenges.
The Minister recalled that the principle of consumer protection and quality assurance is deeply rooted in India’s heritage. He referred to Chanakya’s Arthashastra (4th century BC), which spoke of fair weights and measures, liability for traders, and penalties for adulteration, underlining that consumer rights and quality consciousness have been part of India’s civilizational values.
Referring to Prime Minister Shri Narendra Modi’s vision of “Zero Defect, Zero Effect,” Shri Goyal said that the government is working in mission mode to foster a nationwide culture of quality and sustainability. He explained that this vision reflects a dual commitment—on the one hand, ensuring the highest quality with zero defects in products and services, and on the other, pursuing sustainability with zero effect on the environment and the planet. He noted that the Prime Minister has consistently stressed the importance of combining quality with responsibility, so that India’s growth leaves behind lower pollution and contributes to a sustainable future. Shri Goyal said that this approach is empowering India to build a modern quality ecosystem across sectors. He reiterated the Prime Minister’s belief that the day is not far when the world will proudly say—“Design in India, Made in India,” and such products will be trusted across the globe as symbols of reliability, sustainability, and excellence.
The Minister also underlined the growing role of the electrical and electronic industry in energy efficiency and sustainability. He noted that as India transitions from electrical to electronic solutions, the sector can significantly reduce energy consumption, minimize pollution, and contribute to climate action while ensuring high-quality products for consumers.
Concluding his address, Shri Goyal called upon the global community to work together towards a standardized, safe, and sustainable future, where harmonized standards drive growth, protect consumers, and safeguard the planet for generations to come.
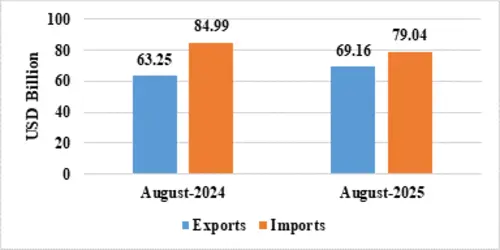
India’s total exports (Merchandise and Services combined) for August 2025* is estimated at US$ 69.16 Billion, registering a positive growth of 9.34 percent vis-à-vis August 2024. Total imports (Merchandise and Services combined) for August 2025* is estimated at US$ 79.04 Billion, registering a negative growth of (-) 7 percent vis-à-vis August 2024.
Table 1: Trade during August 2025*
| August 2025(US$ Billion) | August 2024(US$ Billion) | ||
| Merchandise | Exports | 35.10 | 32.89 |
| Imports | 61.59 | 68.53 | |
| Services* | Exports | 34.06 | 30.36 |
| Imports | 17.45 | 16.46 | |
| Total Trade(Merchandise +Services) * | Exports | 69.16 | 63.25 |
| Imports | 79.04 | 84.99 | |
| Trade Balance | -9.88 | -21.73 |
* Note: The latest data for services sector released by RBI is for July 2025. The data for August 2025 is an estimation. (ii) Data for April-August 2024 and April-June 2025 has been revised on pro-rata basis using quarterly balance of payments data.
Fig 1: Total Trade during August 2025*
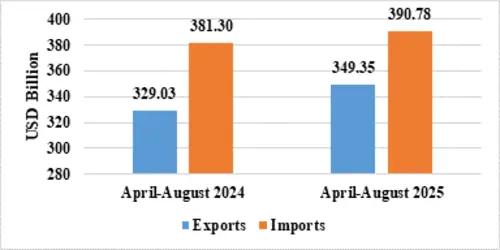
India’s total exports during April-August 2025* is estimated at US$ 349.35 Billion registering a positive growth of 6.18 percent. Total imports during April-August 2025* is estimated at US$ 390.78 Billion registering a growth of 2.49 percent.
Table 2: Trade during April-August 2025*
| April-August 2025(US$ Billion) | April-August 2024(US$ Billion) | ||
| Merchandise | Exports | 184.13 | 179.60 |
| Imports | 306.52 | 300.12 | |
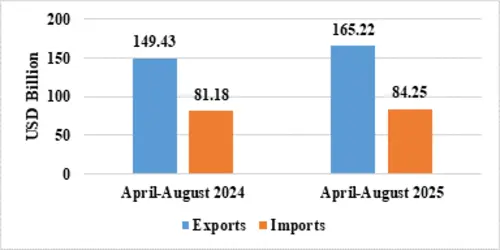
| Services* | Exports | 165.22 | 149.43 |
| Imports | 84.25 | 81.18 | |
| Total Trade(Merchandise +Services) * | Exports | 349.35 | 329.03 |
| Imports | 390.78 | 381.30 | |
| Trade Balance | -41.42 | -52.27 |
Fig 2: Total Trade during April-August 2025*
MERCHANDISE TRADE
Fig 3: Merchandise Trade during August 2025
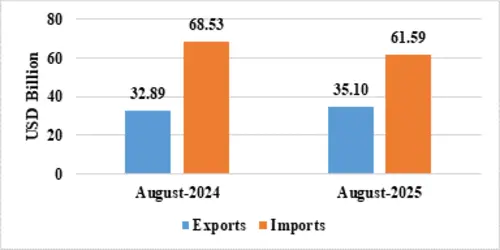
Fig 4: Merchandise Trade during April-August 2025
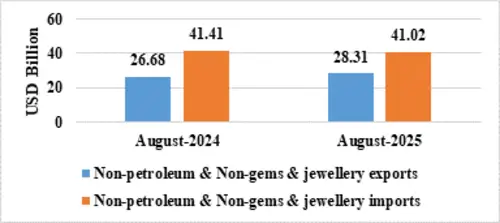
Table 3: Trade excluding Petroleum and Gems & Jewellery during August 2025
| August 2025(US$ Billion) | August 2024(US$ Billion) | |
| Non- petroleum exports | 30.62 | 28.69 |
| Non- petroleum imports | 48.33 | 56.40 |
| Non-petroleum & Non-Gems & Jewellery exports | 28.31 | 26.68 |
| Non-petroleum & Non-Gems & Jewellery imports | 41.02 | 41.41 |
Note: Gems & Jewellery Imports include Gold, Silver & Pearls, precious & Semi-precious stones
Fig 5: Trade excluding Petroleum and Gems & Jewellery during August 2025
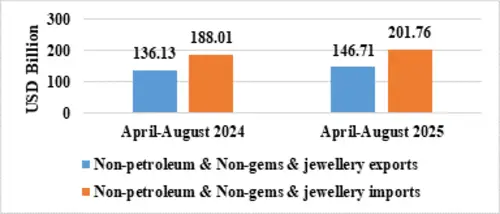
Table 4: Trade excluding Petroleum and Gems & Jewellery during April-August 2025
| April-August 2025(US$ Billion) | April-August 2024(US$ Billion) | |
| Non- petroleum exports | 158.07 | 147.25 |
| Non- petroleum imports | 228.43 | 221.97 |
| Non-petroleum & Non Gems & Jewellery exports | 146.71 | 136.13 |
| Non-petroleum & Non Gems & Jewellery imports | 201.76 | 188.01 |
Note: Gems & Jewellery Imports include Gold, Silver & Pearls, precious & Semi-precious stones
Fig 6: Trade excluding Petroleum and Gems & Jewellery during April-August 2025

SERVICES TRADE
Fig 7: Services Trade during August 2025*
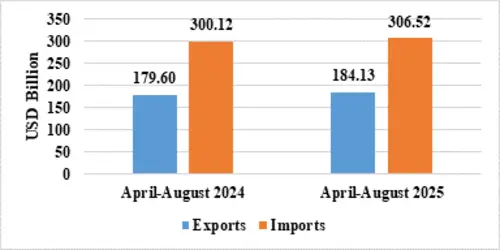
Fig 8: Services Trade during April-August 2025*
Startup India, Department for Promotion of Industry and Internal Trade (DPIIT), Ministry of Commerce and Industry, signed a Memorandum of Understanding (MoU) with CarDekho Group, an autotech and finance solutions platform, to further strengthen India’s startup ecosystem across mobility, fintech, insurtech, and emerging technology sectors.
Under the collaboration, DPIIT and CarDekho Group will accelerate the growth of DPIIT-recognised startups by providing strategic mentorship, market access, technology infrastructure, and funding opportunities. Startups will gain access to CarDekho’s diverse platforms—CarDekho, InsuranceDekho, rupyy, BikeDekho, ZigWheels, PowerDrift, Revv, CollegeDekho, Crack-ED and others—opening avenues for collaborations and customer reach.
The partnership will also explore hosting innovation challenges under the Bharat Startup Grand Challenge to promote entrepreneurship in areas such as electric mobility, auto-tech, finance and sustainability. Startups will have access to CarDekho’s leadership network for domain-specific guidance and co-investment opportunities through the Girnar Vision Fund (GVF). Skill development initiatives will also be undertaken in collaboration with CarDekho brands to build entrepreneurial and technical capabilities among founders and startup teams.
Speaking on the occasion, Joint Secretary, DPIIT, Shri Sanjiv, said that connecting the expertise of leading corporates with the innovation potential of Indian startups will unlock powerful solutions for mobility, finance, and sustainability. He added that the partnership with CarDekho will create opportunities for collaboration, capacity building, and market access across the country.
Co-founder & CEO, CarDekho Group, Amit Jain, said that the company is committed to co-creating with India’s most promising startups and driving innovation that impacts millions. Partnering with DPIIT and integrating with the Startup India platform, he said, will enable CarDekho to mentor, fund, and provide market access to emerging entrepreneurs in mobility, fintech and beyond.
The MoU was signed by Director, DPIIT, Dr. Sumeet Jarangal, and Co-founder & CEO, CarDekho Group, Amit Jain, in the presence of senior officials from both organisations.
The Department of Pharmaceuticals, Ministry of Chemicals and Fertilizers, has initiated preparations for Special Campaign for Disposal of Pending Matters (SCDPM) 5.0, with an aim to saturate pendency across all aspects of governance.
As per the guidelines issued by the Department of Administrative Reforms and Public Grievances (DARPG), the targets of SCDPM 5.0 will be finalized by 25th September, 2025. Necessary instructions have already been issued to all organizations under the Department, including its attached offices, autonomous bodies, PSUs, and societies, to ensure full participation and timely implementation.
Major Achievements under Previous Campaigns (2021–2024)
Since the inception of the Campaign in 2021, the Department of Pharmaceuticals, along with the National Pharmaceutical Pricing Authority (NPPA), National Institutes of Pharmaceutical Education & Research (NIPERs), Public Sector Undertakings [Hindustan Antibiotics Limited (HAL), Karnataka Antibiotics & Pharmaceuticals Limited (KAPL), Bengal Chemicals & Pharmaceuticals Limited (BCPL)], and Pharmaceutical and Medical Devices Bureau of India (PMBI), has successfully undertaken a series of reforms in record management, cleanliness drives, and disposal of scrap.
The World Health Organization (WHO) has published its global cholera statistics for 2024, showing an increase in both the number of people who fell sick and died from the disease.
Reported cholera cases rose by 5% and deaths by 50% in 2024 compared to 2023, with more than 6000 people dying from a disease that is both preventable and treatable. While these numbers are themselves alarming, they are underestimates of the true burden of cholera.
Conflict, climate change, population displacement, and long-term deficiencies in water, sanitation, and hygiene infrastructure continue to fuel the rise of cholera, a disease caused by the bacterium, Vibrio cholerae, which spreads rapidly through faeces-contaminated water.
Sixty countries reported cases in 2024, an increase from 45 in 2023. The burden of the disease remained concentrated in Africa, the Middle East, and Asia, which collectively accounted for 98% of all reported cases.
The scope of cholera outbreaks continued to expand in 2024, with 12 countries each reporting more than 10 000 cases, seven of which experiencing large outbreaks for the first time in the year. The resurgence of cholera in Comoros -after more than 15 years without reported outbreaks - underscores the persistent threat of global transmission.
The case fatality ratio for Africa increased from 1.4% in 2023 to 1.9% in 2024, revealing critical gaps in the delivery of life-saving care, and signaling the fragility of many health systems, along with challenges in access to basic health services.
One quarter of deaths occurred in the community, outside of health facilities, highlighting serious gaps in access to treatment and the need to strengthen work with communities.
To combat cholera, governments, donors and communities need to ensure people have access to safe water and hygiene facilities, have accurate information on how to protect themselves, and rapid access to treatment and vaccination when there are outbreaks. Strong surveillance and diagnostics will help guide these responses. Further investment in vaccine production is also needed.
A new, innovative oral cholera vaccine (OCV), Euvichol-S®, was prequalified in early 2024 and entered the global stockpile. Its addition helped to maintain average stockpile levels above the emergency threshold of 5 million doses for the first 6 months of 2025. However, due to the continued high demand for OCV, the temporary change from a two-dose to a single-dose regimen remained in effect throughout 2024 and into 2025. Requests for 61 million OCV doses were made to the global stockpile in 2024, and a record 40 million were approved for emergency use in reactive, single-dose campaigns in 16 countries. However, supply constraints continued to outstrip demand in 2024, and into 2025.
Preliminary data show that the global cholera crisis continues into 2025, with 31 countries reporting outbreaks since the beginning of the year.
WHO assesses the global risk from cholera as very high, and is responding with urgency to reduce deaths and contain outbreaks in countries around the world. WHO continues to support countries through strengthened public health surveillance, case management, and prevention measures; provision of essential medical supplies; coordination of field deployments with partners; and support for risk communication and community engagement.
Also see:

Media contacts:
Union Health Minister, Shri Jagat Prakash Nadda reviewed the current Dengue and Malaria situation in the country with a view to galvanise preventive activities being undertaken by the States on 10 September 2025. The meeting was attended by Union Health Secretary, Smt. Punya Salila Srivastava and senior officers of the Union Health Ministry.
During the review, Shri Nadda took stock of the current status and key challenges in the prevention and control of Dengue and Malaria. He urged States, local bodies and communities to intensify preventive and control measures, particularly during this high-risk period, to safeguard public health and sustain the gains made in reducing the burden of vector-borne diseases.
The Union Health Minister also issued an advisory to all Chief Ministers urging them to remain vigilant in the coming months and to intensify preventive measures as well as community awareness activities for effective control of Dengue and Malaria.
Shri Nadda stressed the need for urgent and coordinated action against vector-borne diseases. He advised State Health Ministers to personally review the situation and prepare action plans within 20 days, while Municipal Corporations, Panchayats and local bodies were asked to intensify community awareness drives. Hospitals, including those under the Central Government, must ensure adequate drugs, diagnostics, beds and mosquito-free premises. With water stagnation from recent rains creating breeding sites, States and local bodies were asked to step up preventive measures. Intensive IEC and social media outreach will continue to promote community participation and personal protection. He also instructed that a high-level review meeting also be undertaken specifically for Delhi and NCR to closely assess the dengue situation and ensure advance preparedness.
The Union Health Minister underlined that India has made significant progress in combating Malaria. The country has achieved a reduction of over 78% in malaria cases and nearly 78% in malaria-related deaths between 2015 and 2024. Further, 160 districts have reported zero malaria cases between 2022-24, and 33 States/UTs have achieved API (Annual Parasite Incidence) less than one, except three states.
The Government of India has launched multiple initiatives towards malaria elimination, including the National Strategic Plan for Malaria Elimination (2023-27), implementation of the Integrated Health Management Platform (IHIP) for real-time monitoring, enhanced ASHA incentives, large-scale distribution of Long-Lasting Insecticidal Nets (LLINs), refresher trainings for laboratory technicians, and recognition of districts achieving “Zero Malaria” status. India has set the goal of eliminating malaria by 2030.
On Dengue, Shri Nadda noted that all States/UTs (except Ladakh) are endemic to Dengue and Chikungunya, and the risk of outbreaks is highest in the monsoon and post-monsoon period. The National Dengue Control Strategy is being implemented through State Vector-Borne Disease Cells with focus on surveillance, case management, vector control, inter-sectoral coordination and community awareness.
Government of India has also strengthened diagnostic capacity with 869 Sentinel Surveillance Hospitals and 27 Apex Referral Laboratories providing free testing facilities. During 2025 (till date), more than 5,520 Dengue and 2,530 Chikungunya diagnostic kits have been supplied to States. Intensive IEC activities, observance of Anti-Dengue Month (July) and National Dengue Day (16th May), and illumination of India Gate on World NTD Day (30th January) were part of the nationwide campaign to accelerate preventive measures.
Basel, 05 September 2025 - Roche (SIX: RO, ROG; OTCQX: RHHBY) announced today new data from the AVONELLE-X and SALWEEN studies of Vabysmo® (faricimab),1,2 presented at the 25th Euretina Congress in Paris, France. Data from the open-label AVONELLE-X study reinforce the efficacy, safety and durability of Vabysmo over four years in neovascular or “wet” age-related macular degeneration (nAMD), a leading cause of vision loss.1 In the single-arm SALWEEN study, Vabysmo showed clinically meaningful vision gains and retinal drying over one year in polypoidal choroidal vasculopathy (PCV), a vision-threatening subtype of nAMD that is especially common in Asia.2
“The robust SALWEEN findings in PCV highlight Vabysmo’s potential to deliver clinically meaningful improvements and help mitigate vision loss,” said Levi Garraway, MD, PhD, Roche’s chief medical officer and head of Global Product Development. “Alongside the long-term AVONELLE-X results in nAMD, these findings support our mission to develop and deliver impactful medicines for people with difficult-to-treat eye diseases."
In new one-year data from the single-arm, open-label Phase IIIb/IV SALWEEN study of Vabysmo for the treatment of people with PCV in Asia, patients experienced a clinically meaningful gain of 8.9 letters in best-corrected visual acuity (BCVA) from baseline averaged over weeks 40, 44 and 48.2 At year 1, more than 50% of patients were assigned to extended five-month dosing. Vabysmo also had a clinically meaningful impact on the abnormal, polyp-like blood vessels characteristic of PCV, with these lesions completely resolving in more than 60% of patients and inactivation of polypoidal lesions in the majority (86%) of eyes.2 Vabysmo was well tolerated, with a safety profile in PCV that was consistent with its known safety profile in nAMD.2
The AVONELLE-X study was a two-year open label extension of the two-year Phase III TENAYA and LUCERNE studies of Vabysmo in nAMD.1 Vision remained stable throughout the two years of AVONELLE-X and anatomic improvement from the parent trials were sustained through AVONELLE-X.1 Results showed that after up to four years of treatment with Vabysmo, nearly 80% of patients had extended their treatment intervals to every three or four months, reinforcing the results seen in TENAYA and LUCERNE. Vabysmo was well tolerated, and safety data were consistent with its known safety profile in nAMD.1
To date, Vabysmo is approved in more than 100 countries for nAMD and diabetic macular edema (DME), and in more than 60 countries for macular edema following retinal vein occlusion (RVO). More than eight million doses of Vabysmo have been distributed globally since its initial US approval in 2022.3-8
Age-related macular degeneration (AMD) is a condition that affects the part of the eye that provides sharp, central vision needed for activities like reading. nAMD is an advanced form of the disease that can cause rapid and severe vision loss if left untreated.9-11 It develops when new and abnormal blood vessels grow uncontrolled under the macula, causing swelling, bleeding and/or fibrosis.11 Worldwide, around 20 million people are living with nAMD – the leading cause of vision loss in people over the age of 60 – and the condition will affect even more people around the world as the global population ages.9, 12-13
Polypoidal choroidal vasculopathy (PCV) is a subtype of nAMD that is more prevalent in people of Asian or African descent than European descent. It accounts for up to 60% of nAMD cases in people of Asian descent, and up to 20% in people of European descent.14
PCV is characterised by abnormal blood vessels in the choroid, a thin layer of tissue between the sclera (the whites of the eyes) and the retina. These abnormal vessels can leak fluid or blood, leading to retinal damage and vision loss.14-16 People with PCV often experience blurred vision or a blind spot in or near the centre of their vision in one or both eyes.16,17 Early diagnosis and treatment are important to help restore vision and prevent further vision loss.15,18
AVONELLE-X (NCT04777201) was an open label multicenter two-year extension study of Vabysmo in 1,029 patients with nAMD who completed one of the two Phase III studies, TENAYA(NCT03823287) or LUCERNE (NCT03823300).
Patients in TENAYA and LUCERNE were treated with either 6 mg Vabysmo or 2 mg aflibercept. During AVONELLE-X, all patients were treated with Vabysmo on a treat-and-extend regimen, where the time between Vabysmo treatments could be adjusted based on retinal fluid levels and visual acuity.
SALWEEN was a Phase IIIb/IV multicentre, open-label, single-arm study of Vabysmo for the treatment of Asian people with PCV. It enrolled 135 patients aged 50 years and over from 38 sites across nine markets in Asia, including China, Hong Kong SAR, India, Japan, Malaysia, Singapore, South Korea, Taiwan and Thailand. Patients received four loading doses of Vabysmo 6 mg over 12 weeks. After that, their treatment schedule was adjusted based on their progress, with doses given every eight, 12, or 16 weeks. From weeks 44 to 104, patients followed a personalised treatment plan with doses spaced out as far as every 20 weeks. The primary endpoint was the change from baseline in BCVA averaged over weeks 40-48.
Vabysmo is the first bispecific antibody approved for the eye. 3,4,19 It targets and inhibits two signalling pathways linked to a number of vision-threatening retinal conditions by neutralising angiopoietin-2 (Ang-2) and vascular endothelial growth factor-A (VEGF-A). Ang-2 and VEGF-A contribute to vision loss by destabilising blood vessels, causing new leaky blood vessels to form and increasing inflammation. By blocking pathways involving Ang-2 and VEGF-A, Vabysmo is designed to stabilise blood vessels.19,20 Vabysmo is approved in more than 100 countries around the world, including the United States (US), Japan, the United Kingdom and the European Union (EU) for people with neovascular or ‘wet’ age-related macular degeneration and diabetic macular edema, and in more than 60 countries, including the US, EU and Japan, for people with macular edema following retinal vein occlusion (RVO).3-8 Review by other health authorities is ongoing.
Roche is focused on saving people’s eyesight from the leading causes of vision loss through pioneering therapies. Through our innovation in the scientific discovery of new potential drug targets, personalised healthcare, molecular engineering, biomarkers and continuous drug delivery, we strive to design the right therapies for the right patients.
We have the broadest retina pipeline in ophthalmology, which is led by science and informed by insights from people with eye diseases. Our pipeline includes innovative treatments across different modalities, such as antibodies, and gene and cell therapies targeting multiple vision-threatening conditions, including retinal vascular and diabetic eye diseases, geographic atrophy, and autoimmune conditions, such as thyroid eye disease and uveitic macular edema.
Applying our extensive experience, we have already brought breakthrough ophthalmic treatments to people living with vision loss. Susvimo® (previously called Port Delivery System with ranibizumab) 100 mg/mL for intravitreal use via ocular implant is the first United States Food and Drug Administration-approved refillable eye implant for nAMD that continuously delivers a customised formulation of ranibizumab over a period of months.21 Vabysmo® (faricimab) is the first bispecific antibody approved for the eye, which targets and inhibits two signalling pathways linked to a number of vision-threatening retinal conditions by neutralising angiopoietin-2 and vascular endothelial growth factor-A.3 Vabysmo is approved around the world for people living with nAMD, DME and macular edema following RVO.3,5 Lucentis® (ranibizumab injection) was the first treatment approved to improve vision in people with certain retinal conditions.22
Founded in 1896 in Basel, Switzerland, as one of the first industrial manufacturers of branded medicines, Roche has grown into the world’s largest biotechnology company and the global leader in in-vitro diagnostics. The company pursues scientific excellence to discover and develop medicines and diagnostics for improving and saving the lives of people around the world. We are a pioneer in personalised healthcare and want to further transform how healthcare is delivered to have an even greater impact. To provide the best care for each person we partner with many stakeholders and combine our strengths in Diagnostics and Pharma with data insights from the clinical practice.
For over 125 years, sustainability has been an integral part of Roche’s business. As a science-driven company, our greatest contribution to society is developing innovative medicines and diagnostics that help people live healthier lives. Roche is committed to the Science Based Targets initiative and the Sustainable Markets Initiative to achieve net zero by 2045.
Genentech, in the United States, is a wholly owned member of the Roche Group. Roche is the majority shareholder in Chugai Pharmaceutical, Japan.
For more information, please visit www.roche.com.
All trademarks used or mentioned in this release are protected by law.
References
[1] Khanani et al. Four-Year Outcomes of Faricimab in nAMD: Safety and Efficacy Results From the AVONELLE-X Long-Term Extension Trial – 4-7 September, EURETINA 2025.
[2] Lai et al. Faricimab for Polypoidal Choroidal Vasculopathy: 1-Year Results from the Phase IIIb/4 SALWEEN Trial. EURETINA. September 4-7, 2025
[3] United States (US) Food and Drug Administration (FDA). Highlights of prescribing information, Vabysmo. 2024. [Internet; cited August 2025]. Available from: https://www.accessdata.fda.gov/drugsatfda_docs/label/2024/761235s005lbl.pdf.
[4] Medicines and Healthcare products Regulatory Agency approves faricimab through international work-sharing initiative. [Internet; cited August 2025]. Available from: https://www.gov.uk/government/news/mhra-approves-faricimab-through-international-work-sharing-initiative.
[5] European Medicines Agency. Summary of product characteristics, Vabysmo. 2024. [Internet; cited August 2025]. Available from: https://www.ema.europa.eu/en/documents/product-information/vabysmo-epar-product-information_en.pdf.
[6] Chugai obtains regulatory approval for Vabysmo, the only bispecific antibody in the ophthalmology field, for additional indication of macular edema associated with RVO. [Internet; cited August 2025]. Available from: https://www.chugai-pharm.co.jp/english/news/detail/20240326160000_1054.html.
[7] Chugai obtains regulatory approval for Vabysmo, the first bispecific antibody in ophthalmology, for nAMD and DME. [Internet; cited August 2025]. Available from: https://www.chugai-pharm.co.jp/english/news/detail/20220328160002_909.html.
[8] Roche data on file.
[9] Facts & figures - macular degeneration. BrightFocus Foundation. May 15, 2025. [Internet; cited August 2025]. Available from: https://www.brightfocus.org/macular/facts-figures/.
[10] Pennington KL, DeAngelis MM. Epidemiology of age-related macular degeneration (AMD): Associations with cardiovascular disease phenotypes and lipid factors. Eye and Vision. 2016;3(1). doi:10.1186/s40662-016-0063-5.
[11] Little K, Ma JH, Yang N, Chen M, Xu H. Myofibroblasts in macular fibrosis secondary to neovascular age-related macular degeneration - the potential sources and molecular cues for their recruitment and activation. eBioMedicine. 2018;38:283-291. doi:10.1016/j.ebiom.2018.11.029.
[12] Wong WL, et al. Global prevalence of age-related macular degeneration (AMD) and disease burden projection for 2020 and 2040: a systematic review and meta-analysis. Lancet Global Health. 2014;2:106–16.
[13] Connolly E, et al. Prevalence of AMD associated genetic risk factors and four-year progression data in the Irish population. British Journal of Ophthalmology. 2018 Feb;102:1691-95
[14] Cheung CM. Macular neovascularization and polypoidal choroidal vasculopathy: Phenotypic variations, pathogenic mechanisms and implications in management. Eye. 2023;38(4):659-667. doi:10.1038/s41433-023-02764-w.
[15] Cheung CM, Lai TYY, Ruamviboonsuk P, et al. Polypoidal choroidal vasculopathy: Definition, Pathogenesis, Diagnosis, and Management.Ophthalmology. 2018;125(5):708-724. doi:10.1016/j.ophtha.2017.11.019.
[16] The Foundation of the American Society of Retina Specialists. Polypoidal choroidal vasculopathy. Polypoidal Choroidal Vasculopathy - Patients - The foundation of the American Society of Retina Specialists. [Internet; cited August 2025]. Available from: https://www.asrs.org/patients/retinal-diseases/30/polypoidal-choroidal-vasculopathy.
[17] Pautler S. Polypoidal choroidal vasculopathy. Scott E. Pautler, M.D. Tampa. December 3, 2022. [Internet; cited August 2025]. Available from: https://www.scottpautlermd.com/polypoidal-choroidal-vasculopathy/. Pautler SE. Polypoidal Choroidal Vasculopathy.
[18] Chawla H, Blair K, Vohra V. Polypoidal Choroidal Vasculopathy. In: Stat Pearls. Stat Pearls Publishing; 2025. [Internet; cited August 2025]. Available from: http://www.ncbi.nlm.nih.gov/books/NBK567780/.
[19] Heier JS, et al. Efficacy, durability, and safety of intravitreal faricimab up to every 16 weeks for nAMD (TENAYA and LUCERNE): two randomised, double-masked, phase III, non-inferiority trials. The Lancet. 2022; 399:729-40.
[20] Wykoff C, et al. Efficacy, durability, and safety of intravitreal faricimab with extended dosing up to every 16 weeks in patients with DME (YOSEMITE and RHINE): Two randomised, double-masked, phase III trials. The Lancet. 2022; 399:741-755.
[21] US Food and Drug Administration (FDA). Highlights of prescribing information, Susvimo. 2021. [Internet; cited August 2025]. Available from: https://www.accessdata.fda.gov/drugsatfda_docs/label/2021/761197s000lbl.pdf.
[22] US FDA. Highlights of prescribing information, Lucentis. 2014. [Internet; cited August 2025]. Available from: https://www.accessdata.fda.gov/drugsatfda_docs/label/2012/125156s0069s0076lbl.pdf.
Roche Global Media Relations
Phone: +41 61 688 8888 / e-mail: media.relations@roche.com
| Hans Trees, PhD Phone: +41 79 407 72 58 | Sileia Urech Phone: +41 79 935 81 48 |
| Nathalie Altermatt Phone: +41 79 771 05 25 | Lorena Corfas Phone: +41 79 568 24 95 |
| Simon Goldsborough Phone: +44 797 32 72 915 | Karsten Kleine Phone: +41 79 461 86 83 |
| Kirti Pandey Phone: +49 172 6367262 | Yvette PetillonPhone: +41 79 961 92 50 |
| Dr Rebekka Schnell Phone: +41 79 205 27 03 |
Roche Investor Relations
| Dr Bruno Eschli Phone: +41 61 68-75284 e-mail: bruno.eschli@roche.com | Dr Sabine Borngräber Phone: +41 61 68-88027 e-mail: sabine.borngraeber@roche.com |
| Dr Birgit Masjost Phone: +41 61 68-84814 e-mail: birgit.masjost@roche.com |
Investor Relations North America
| Loren Kalm Phone: +1 650 225 3217 e-mail: kalm.loren@gene.com |
Attachment
In accordance with the directions of Hon’ble Prime Minister Shri Narendra Modi towards reducing the regulatory compliance and towards promoting ease of doing business in the pharmaceutical and clinical research sectors, the Union Health Ministry is set to amend the New Drugs and Clinical Trials (NDCT) Rules, 2019. The proposed amendments were published in the Gazette of India on 28th August, 2025 seeking public comments. The amendments aim to simplify the requirements and procedures for obtaining test licences and for submitting applications related to Bioavailability/Bioequivalence (BA/BE) studies. Key highlights of the proposed amendments are as under:
Under the proposed amendment, the present license system for test licenses has been converted to a notification/intimation system. Through this, the applicants need not wait for test licenses (except a small category of high risk category drugs) but will need to just intimate the Central Licensing Authority. Additionally, the overall statutory processing time for test licence applications will be reduced from 90 days to 45 days.
Under the proposed amendment, the existing licence requirement will be dispensed with for certain categories of BA/BE studies, which may instead be initiated upon submission of an intimation or notification to the Central Licensing Authority.
These regulatory reforms are expected to benefit stakeholders by significantly reducing the timelines for processing applications. These proposed amendments will reduce the number of license applications being submitted by approximately 50%. This will facilitate quicker initiation of BA/BE studies, testing and examination of drugs for research, and reduce delays in the drug development and approval processes.
Moreover, the amendments will enable the Central Drugs Standard Control Organization (CDSCO) to optimise the deployment of its human resources, thereby enhancing the efficiency and effectiveness of regulatory oversight.
This initiative underscores the Government of India’s commitment to ongoing regulatory reforms in the pharmaceutical sector. It forms a part of the broader efforts toward Ease of Doing Business to promote the growth of the Indian pharma industry and align domestic regulations with global best practices. These steps are expected to increase attractiveness of India for clinical research thereby strengthening India’s position as a global hub for pharmaceutical research and development.